Why AI projects fail: 19 headline statistics, and what each one actually counts
Jamie Watters
Operational resilience and AI delivery practitioner.
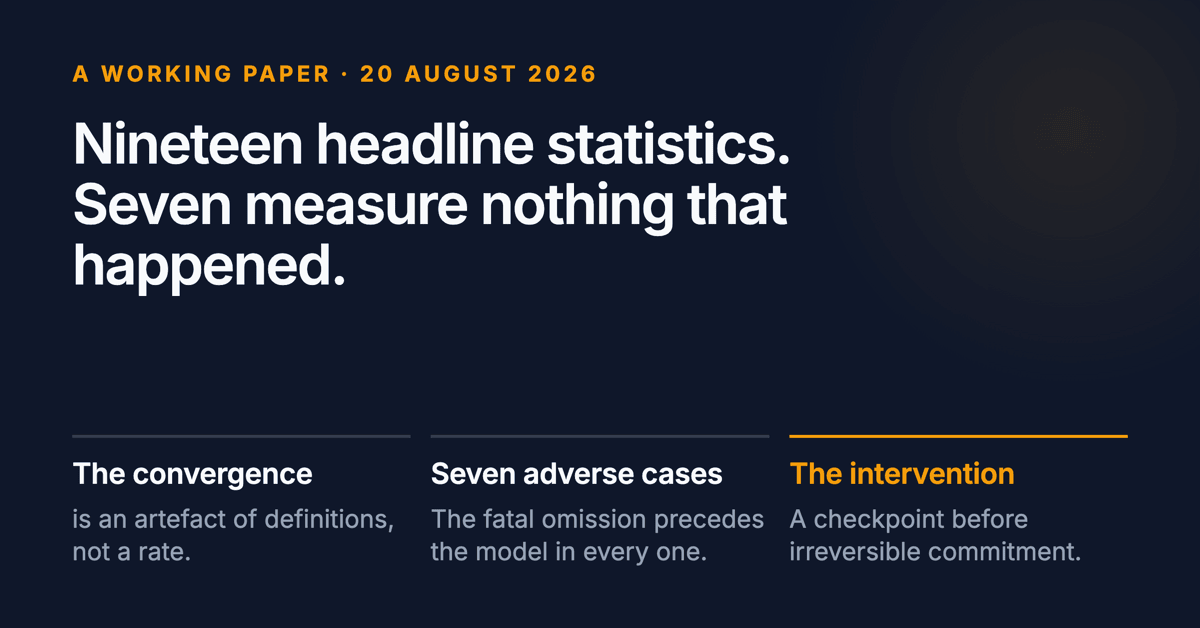
Who this is for. Anyone who has to quote, defend or act on an AI failure rate: buying, governing, or writing the business case. By the end you'll know what each of nineteen widely repeated statistics actually counts, and which seven are not measurements of anything that happened.
Skip it if you want a method for running AI projects well. This is an audit of the evidence behind the failure claims, not a delivery guide.
A working paper. Jamie Watters. Version of 20 August 2026.
Abstract
Every widely circulated statistic about AI project failure measures a different thing, and the apparent convergence of those statistics is an artefact of definitional heterogeneity rather than evidence of an underlying rate. This review traces nineteen headline figures to their primary sources and classifies each by what it measures, on what unit, over what window, and whether it is a measurement at all. Seven of the nineteen are not observations of anything that happened. The claim this field repeats most, that 80% of AI projects fail at twice the rate of conventional IT projects, resolves on inspection into a paraphrase of unnamed opinion surveys quoted in a magazine profile of a vendor, joined to an unsourced clause comparing a 2023 figure to IT failures from a decade earlier.
Beneath the statistical confusion sits a body of causal evidence that is genuinely convergent, across one coded frequency distribution and six further methodologically independent samples, and that points to a conclusion the pre-AI project literature reached decades ago, though it is attribution rather than demonstrated causation: failure is concentrated in decisions made before the model exists, is predominantly a matter of problem formulation and data foundation, and is in principle detectable at the time it is being caused. Around that sits an incentive structure that would explain why the standing advice does not take, assembled here from separately evidenced components and never tested as a whole. That evidence is thinner than its citation implies, and almost all of it was gathered to explain predictive machine learning rather than generative AI.
Across seven adverse cases, six terminated failures and one contested continuing deployment, and two documented successes, the fatal omission precedes the model in every case. Across six of those seven the number of things genuinely unknowable at the time is two: that is a count of decisions within these nine hand-selected cases, not a general finding about AI projects, and Section 7.5 sets out how the sort was made. What distinguishes the successes is not model quality but five conditions established before the projects began. What is novel about AI is not the failure mechanism but the intensity of its inputs. What is genuinely unmeasured is not the rate but the distribution: what makes IT distinctive among 23 project types is its tail rather than its mean, and no published AI study reports a distributional shape at all.
The review's practical contribution is to relocate the point of intervention, from improving the model to interposing a deliberate checkpoint between AI output and irreversible organisational commitment.
How to read this
Sections 1 to 4 are the audit: what the numbers measure, how the review was conducted, the taxonomy, and what the pre-AI baseline can and cannot support. Section 5 puts the strongest challenge to the whole enterprise before the causal argument rather than after it. Sections 6 to 9 are the causal account: what the evidence supports, when the decisions were made, the cases, and why the standing advice does not take. Sections 10 to 12 are what follows: pre-project conditions, practices, and the research agenda. Section 13 concludes.
A reader with an hour should read Sections 3, 8 and 11.
Three conventions run throughout. Verbatim quotations preserve their source's own punctuation, including where that differs from this document's house style. Where a claim rests on a near-primary source rather than a document I read myself, the text says so at the point of use rather than in a footnote. And where a figure could not be verified, it does not appear.
Contents
- Introduction
- Method and evidentiary standards
- The measurement problem: a taxonomy of failure definitions
- The pre-AI baseline: is this a new failure?
- The competing specification: is any of this failure at all?
- What the evidence actually supports about causes
- Timing: when the fatal decisions were made, and whether anyone could have known
- The cases
- Second-order causes: why the advice does not take
- What the survivors had: pre-project conditions
- Practices: what to do, and why the standard list is insufficient
- Research agenda
- Conclusion
References Appendix: retrievals outstanding at the time of writing
1. Introduction
Writing on AI project failure returns, again and again, to one claim: that 80% of AI projects fail, at roughly twice the rate of conventional IT projects. Five of the seven syntheses this review began from repeat it. Here is where it comes from.
RAND's 2024 report The Root Causes of Failure for Artificial Intelligence Projects and How They Can Succeed: Avoiding the Anti-Patterns of AI says, twice, "By some estimates, more than 80 percent of AI projects fail." The hedge is RAND's own. The footnote attached to it is complete and reads, in full: "13. Kahn, 'Want Your Company's AI Project to Succeed?'"
That is Jeremy Kahn writing in Fortune on 26 July 2022, in a profile of the chief executive of Aible, a company that sells AI software. The relevant sentence in Kahn is: "That's borne out in a slew of recent surveys, where business leaders have put the failure rate of A.I. projects at between 83% and 92%."
So the chain runs: unnamed surveys, of business leaders' opinions about a failure rate, giving a range of 83 to 92 per cent, quoted in a trade-press profile of a vendor selling the remedy, rounded down by RAND to "more than 80 percent" with a hedge attached, and then stripped of the hedge by essentially every downstream citation into "RAND found that 80% of AI projects fail".
RAND generated no failure-rate estimate of its own. The study design could not produce one. It is an exploratory interview study about causes, with failure defined perceptually as "a project that was perceived to be a failure by the organization", and no denominator of projects anywhere in it. RAND's handling of the figure is defensible. What happened to it afterwards is not.
The comparison half is worse. "Twice the rate of IT projects" traces to Bojinov in Harvard Business Review, November-December 2023: "Some estimates place the failure rate as high as 80% — almost double the rate of corporate IT project failures from a decade ago." No source is given for either number. Note the phrase "from a decade ago": Bojinov is comparing a 2023 AI figure to IT failures from around 2013, and the ten-year gap disappears in every restatement.
There is no dataset. There is no consistent definition. There are no two comparable samples. The numerator and the denominator were never measured by the same instrument, or, as far as I can establish, by any instrument. The most repeated empirical claim in this field is not an empirical claim.
I want to be careful about what that does and does not prove. It does not prove that AI projects succeed. It proves that the number everyone repeats is not evidence about anything, and that nobody checked it for four years. The field has produced very little synthesis of itself in that time: one peer-reviewed scoping review, and one seven-page working paper that reaches a version of this section's conclusion from six grey-literature sources. Neither traces the chain.
The spread
The 80% is not alone. In circulation, presented as broadly interchangeable measurements of the same thing, are 80%, 85%, 87%, 42%, 46%, 95%, 28% and 74%.
Some of those are predictions with no sample. Some are shares of companies rather than of projects. One is an unsourced remark from a conference panel. One describes projects delivering biased outputs rather than failing. One describes companies that have "yet to show" value, which is a statement about timing. Section 3 classifies all of them.
Two examples are enough to show the shape of the problem, and both come from inside the sources rather than from my reading of them.
S&P Global's own AI research programme reported in January 2025 that the share of companies abandoning the majority of their AI initiatives had risen from 17% to 42% year over year, and in July 2025 that the average share of projects abandoned before production had fallen from 31% to 24%. Rising and falling, same programme, same year, different populations and metrics. Both are true. Only one is quoted.
The MIT NANDA report, source of the 95% figure that dominated the second half of 2025, contains a chart on page 6 showing 40% implementation for general-purpose LLMs against 5% for task-specific tools. The headline generalises from the worse of the two categories that the report itself distinguishes. And only the 5% carries a stated success definition: the report scopes its definition, in its own words, to task-specific tools, so the 40% has no success criterion stated anywhere in the document. The chart is in the report. The distinction is in the report. Neither is in the coverage.
What this review does instead
The question "what percentage of AI projects fail?" is malformed, and answering it better is not the contribution I am trying to make. Improving the estimate presumes there is a quantity being estimated, and Section 3 argues there is not, yet.
Four questions replace it.
What do the existing numbers measure? This is answerable now, completely, from primary sources, and Section 3 answers it. It is the flagship of the review because it is the part where the evidence is complete and the work has simply not been done.
Which causal mechanisms are actually corroborated, and how thin is the base? Underneath the statistical confusion there is a body of causal evidence that is genuinely convergent across independent methods and samples. It points, consistently, to problem formulation and data foundation, and every source behind it reads those causes as organisational rather than technical. It is also thinner and more fragile than the confidence of its citation implies, and almost none of it is about generative AI. Section 6 sets out both halves.
When were the fatal decisions made, and could anyone have known at the time? Section 7 makes the argument from adjacent literature and Section 8 tests it against nine documented cases: seven adverse ones, being six terminated failures and one contested continuing deployment, and two successes. The short version is that the fatal omission precedes the model in every case, and that the set of things which were genuinely unknowable at the time is very close to empty.
Is any of this distinctive to AI? Section 4 shows that the comparator, the IT project failure literature, is itself an artefact of definition to a degree that swamps any real variation, and that the one dimension on which a genuine difference could be established, the shape of the outcome distribution, is the one dimension nobody has looked at.
There is a fifth question, and it is the one that decides whether the other four matter: is any of this failure at all? A general purpose technology is predicted, from theory, to show negative measured returns during the period when its complementary intangibles are being built. An organisation two years into AI adoption showing no measured return is the expected observation under that theory, not evidence of a failed project. The failure-rate literature cannot distinguish a failed project from a project in the trough of its productivity J-curve, and has never tried. Section 5 puts that challenge before the causal account rather than after it, because a causal account of a phenomenon should come second to establishing that the phenomenon exists.
What I think the answer is
Stated plainly, so that a reader can disagree with it early.
Failure is concentrated in decisions made before the model exists. It is predominantly a matter of problem formulation and data foundation, and the incentive structure around those decisions looks like the reason the standing advice does not take, though nobody has run the study that would show it. It is in principle detectable at the time it is being caused. What is novel about AI is not the mechanism but the intensity of its inputs: higher information asymmetry, vaguer success criteria, research-and-development framing as the default, and unusually strong external pressure to announce. Every one of those is a known amplifier of a known failure mechanism in the pre-AI literature, and none of them is new.
What is genuinely unmeasured is not the rate but the distribution.
And the practical conclusion is not another remedy list. The standard list has been correct for a decade, which is fairly good evidence that stating it again is not the intervention. The intervention that follows from the case evidence is narrower and stranger: in almost every documented failure, the decisive moment was not the model's output but the conversion of that output into an irreversible organisational commitment. Capital deployed on a house that could not be unbought. A grade issued to a student. An alert fired on a ward. The leverage sits at that conversion, and none of the standard frameworks puts anything there.
A note on tone before I start, because the register of this review is deliberate. I am not neutral about the citation practices described in Section 3. A field that has repeated a vendor-profile paraphrase of unnamed opinion surveys for four years, as its foundational statistic, while a peer-reviewed critique of exactly this failure mode has sat in the IT project literature since 2010, is not suffering from an absence of evidence. It is suffering from an absence of reading.
2. Method and evidentiary standards
This is a structured narrative review, not a meta-analysis. A meta-analysis would require that the studies be measuring the same construct, and Section 3 is an argument that they are not. Pooling them would manufacture exactly the false precision the review exists to complain about.
Scope. Organisational AI and machine learning project outcomes, covering both the classic predictive ML era and the generative AI era, from 2015 to 2026. Individual-worker productivity studies are included only as a contrast class, because they are the methodologically strongest work in the area and they measure something other than project outcomes, which is itself a finding. Consumer AI, model safety research and the AI incident literature are out of scope except where a case sits in both.
The verification protocol. Every load-bearing claim in this review was traced to a primary source that was actually fetched and read. Where a claim could only be established from a near-primary source, such as a journalist who read a document I could not obtain, the review says so at the point of use rather than in a footnote. Where a claim could not be established at all, it does not appear.
Three distinctions do most of the work.
The first is between a measured, a predicted and an estimated number. Four of the most cited figures in this field are analyst predictions with no sample behind them, and they are quoted in the same breath as survey measurements. Gartner's 85%, its 30%, its 60% and its over-40% are forecasts. They may turn out to be right. They are not observations, and no retrospective on any of the four has been published.
The second is between the tier of a source and the status of a specific claim in it. A peer-reviewed paper in a strong journal can carry a claim that is unverifiable from the paper itself, and a trade-press article can carry a verbatim quotation that is the best available evidence for something. Bérubé, Giannelia and Vial's Delphi study is peer-reviewed and its ranked list of sixteen barriers is cited downstream as an established ranking, but the paper's own Kendall's W was 0.432 after two rounds, which the authors themselves call "a slight improvement, but still somewhat low" against their stated scale where 0.3 or below is low. The source tier is high. The status of the ranking claim is that the panel did not reach consensus.
The third, and the most productive single test in this review, is hedge survival. Does the popular version of a claim still carry the author's own limitations? This test fires repeatedly and it fires in one direction. RAND's disclaimer that its sample "may be skewed toward identifying leadership failures" is carried by almost nobody downstream. The MIT NANDA report's concession that its six-month window may be "potentially understating success rates" appears in none of the coverage. Gartner's "unsupported by AI-ready data" clause is load-bearing and universally stripped. Alegion's figure is about projects that "stall", not fail. BCG's is about companies that have "yet to show" value, which is a statement about timing. Sculley et al. have no number at all, and the number attributed to them was invented downstream.
In each of those cases the primary source is more careful than its reputation. The error is not in the research. It is in the transmission, and every time I traced one, it had moved in the direction that made the sentence tidier.
How the corpus was assembled, and what that biases
Everything above describes how a claim was checked once it was in front of me. It does not describe how it got in front of me, and a review that makes absence claims owes the reader that. Several claims in this paper take the form of reporting that no study measures a particular thing. Those are only as good as the search behind them, so here is the search, including the parts that do not flatter it.
The starting point was the prior-art survey described at the end of this section, followed by citation chaining: every figure and every source named in that material was traced upstream until it reached a primary document or ran out of chain, and every primary document found that way was read for the sources it in turn cited. Targeted searching filled gaps where the chain implied something should exist, which is how most of the negative findings arose: I went looking for the matched-sample study, the AI distributional statistic, the analyst retrospective, and the coding of data failures by purpose, and reported not finding them.
This is a citation-chained corpus, not a database search. No search strings were pre-registered, no databases were systematically enumerated, and no second reviewer screened anything. That has a specific consequence worth naming: a chained corpus is dense where the literature cites itself and blind where it does not. Work that is methodologically sound but rarely cited, work published outside English, and work in venues this literature ignores are all systematically under-represented. When this paper says no study reports something, the defensible reading is that no study reachable by chaining from the field's own most-cited documents reports it. That is a weaker claim than an exhaustive absence and it is the one I can support.
The nineteen statistics are the figures encountered repeatedly across that corpus, selected because they recur rather than by any threshold or sampling rule. They are prominent, not a population. Nineteen is a count of what the review met and could classify, not an estimate of how many such figures exist, and a different starting point would produce a different set with, I would expect, a substantially overlapping core. The classification in Section 3 does not depend on the count; the argument is about what each figure measures, and it would survive the set being twelve or thirty.
The nine cases were selected on documentary richness: a case is in the set if primary documents exist that let the failure be reconstructed rather than retold, which in practice meant audits, regulatory filings, court orders, FOI disclosures and peer-reviewed validation studies. That criterion is the reason the case analysis can say anything, and it is also its sharpest limitation. Cases become documented when something forces disclosure, which means litigation, a listed company's reporting obligations, a public-sector inspection or an academic with access. The quietly cancelled internal project generates no documents and cannot enter a set assembled this way. So the cases are not a sample of AI failures, they are a sample of AI failures that became legible, and Section 7.1 makes the same point about incident databases. A reader who suspects the upstream-causation finding in Section 7 is an artefact of selecting cases that generate paper trails is raising the right objection, and Section 12 proposes the prospective cohort that would answer it.
Where the sources have gone
Four sources refused automated retrieval during evidence gathering and needed a browser, an archive index or an institutional login: Springer, for Li et al.'s scoping review; SSRN, for Vallone's working paper; Wiley, for Rodriguez Müller and colleagues' experiment on institutional pressure; and utsystem.edu, for the University of Texas System audit of MD Anderson's Oncology Expert Advisor project. All four were eventually reached, though not to the same depth, and the differences matter under this review's own standard. Rodriguez Müller and colleagues' paper was read in full. So was the audit. Li et al.'s article body remains paywalled: the positioning in Section 6.7 rests on its public reference list and methodological appendix, which is enough for that argument and would not be enough for any other. Vallone's paper was settled from its abstract, its declared interest and its stated scope rather than from the full seven pages. The fourth source is worth describing at length, because how it was obtained belongs in the method rather than in a footnote to Section 8.
The UT System landing page for the Special Review returns a permissions error, and its public page renders "Content unavailable". That is not a stale search-engine link. The page exists and the document has been removed from it. The audit was recovered instead from a snapshot taken on 21 February 2017, located through an archive index rather than through the ordinary archive interface, and it is 48 pages of readable text. A copy is archived alongside this review.
So the position is this. Two of the most cited primary sources in this field cannot be obtained from the institutions that produced them. The MIT NANDA report is absent from MIT Media Lab domains, which is consistent with its having been removed but does not establish it, and I make no claim that it was. The UT System audit was removed: its page is still there and its document is not. Both are cited constantly, in 2026, by people who cannot have read them there.
I take that to be a fact about the field's citation practice rather than an inconvenience of mine. A literature whose foundational documents can disappear from their publishers without anyone noticing is a literature in which citation does not depend on the source remaining available, which is precisely the condition under which claims drift free of their conditions. This review keeps its own archive of both for that reason.
Recovering the audit changed the substance of Section 8 and not in the direction I expected. Every published account of the MD Anderson case, including the ones written by people who did read the audit in 2017, reports that it declined to assess whether Watson worked. That is true and it is not the whole sentence. The audit states, in its own bold, that MD Anderson "has engaged an external consulting firm to conduct a review of the system for that purpose". The clinical assessment was not omitted. It was assigned. The audit names neither the firm nor any output, and I have found no evidence that the review was ever completed or released. That is a better fact than the one it replaces, and it sat, for the better part of a decade, in a document that had been taken offline.
A full list of retrievals still outstanding appears at the end, and the sections that depend on them say so where they depend on them.
A note on the review's own inputs
This review began from seven syntheses of the AI failure literature produced by large language models, used as a prior-art survey rather than as sources. Every load-bearing claim in all seven was then re-checked against a primary source, across six parallel workstreams.
Two things came out of that which are worth reporting, because they bear on how this literature propagates rather than on what it says.
The first is that six of the seven converged on essentially the same five-cause taxonomy, and they converged because they are all reading the same handful of documents, most of which are reading each other. Convergence of that kind measures citation-network density, not evidential weight. Six language models agreeing is a fact about training data.
The second is that two of the seven independently produced the same fabricated study: a review of "over 2,400 enterprise initiatives", attributed in one case to RAND, with a percentage split of causes that RAND does not report and a failure rate that no located analysis contains. RAND conducted 65 interviews. It reviewed no enterprise initiatives. Two separate models generated a citable-sounding artefact with the same fictitious sample size, which is a reasonable illustration of how a number enters circulation and then gets repeated by people who assume somebody upstream checked.
I include it because the review's subject is claims travelling without their conditions, and it would be odd to exclude the clearest example I met on the grounds that I met it in my own method.
3. The measurement problem: a taxonomy of failure definitions
Put the headline figures in a row and they look like a consensus. Eighty per cent. Eighty-five. Eighty-seven. Ninety-five. Different researchers, different years, different methods, all landing in the same band. In any other field that would be convergent validity, and you would start believing the number.
It is not convergent validity. The figures are not estimates of one quantity with differing precision. They are measurements of different constructs, taken on different units, over different windows, against incompatible success criteria, and several of them are not measurements at all. Their clustering in the seventy to ninety-five per cent range is produced by that heterogeneity. Once you classify them properly the cluster dissolves, and what is left is a short list of numbers that mean something and a long list that does not.
This section does the classification. It is the least glamorous part of the paper and the part I am most confident in.
3.1 The classification frame
The frame is not new and does not need to be. Lyytinen and Hirschheim proposed four types of information systems failure in 1987, nearly forty years before the current literature, and every modern figure maps onto one of them or onto none.
Correspondence failure is a lack of correspondence between stated objectives and evaluation: the system did not do what it was said it would do. Process failure is unsatisfactory development performance, including budget and schedule: the thing was not built, or was not built on the terms agreed. Interaction failure is a system that gets built and does not get used. Expectation failure is a failure to meet a specific stakeholder group's expectations, and Lyytinen and Hirschheim present it as the superset of the other three, on the grounds that correspondence, process and interaction failure all assume a rational, apolitical view of system development.
That last point is the one worth pausing on, because it is precisely the assumption the AI failure literature makes without noticing. A figure that reports how many organisations got no return is a correspondence measure, and correspondence measures presuppose that there was a single agreed objective against which return could be assessed. In most of the cases in Section 8 there was not. Expectation failure is the superset because organisations are political, and Section 9 argues that the politics is not noise around the signal but a large part of the signal.
One honesty note about this frame, made once here and not repeated. I read Lyytinen and Hirschheim's four types in a 1999 secondary source quoting the original, not in the original. The four definitions are stable across the secondary literature and I have no reason to doubt them, but I have not held the 1987 paper. Given that this review's central complaint is about claims travelling without their sources, saying so is the minimum.
3.2 The taxonomy table
Every figure below has been traced to the primary release or publication that first stated it, except where the row itself says otherwise. Three columns do the work: what the figure actually measures, on what unit, and whether it is a measurement at all.
| Figure | Source | What it actually measures | Unit | Window | Type | Nature |
|---|---|---|---|---|---|---|
| 85% | Gartner, 13 Feb 2018 | AI projects delivering erroneous outcomes due to bias in data, algorithms or teams | projects | through 2022 | none of the four; an output-quality claim | predicted, no sample |
| 87% | VentureBeat, 2019 | nothing; a conference-panel remark restating an unsourced 13% from a 2017 opinion column | undefined | none | undefined | unsourced |
| 78% | Dimensional Research / Alegion, 2019 | projects stalling at some stage before deployment | projects | none stated | process | measured, n=227, vendor-sponsored |
| >80% | RAND 2024, quoting Kahn (Fortune) 2022 | business leaders' opinions of the failure rate, from unnamed surveys, given as a range of 83 to 92% | opinions | none | undefined | estimated, no sample |
| 45.27% reach production | Kalinowski et al. 2025 | practitioner-reported share of ML projects reaching production | projects, self-reported | none | process | measured, bootstrapped |
| 42% (from 17%) | S&P Global, VotE Use Cases 2025 | share of companies abandoning the majority of their AI initiatives before production | companies | year over year | process | measured, n=1,006 |
| 46% | same instrument | average share of projects scrapped between proof of concept and broad adoption | projects | PoC to adoption | process | measured |
| 24% (from 31%) | 451 Research, VotE Infrastructure 2025 | average share of projects abandoned prior to production | projects | none | process | measured, n=704, opposite trend to the 42% |
| 95% | MIT NANDA, 2025 | organisations reporting zero return, on a remark-based criterion, restricted to task-specific tools | organisations, then restated as solutions | ~6 months post-pilot | correspondence | measured on a subjective criterion, n=52 interviews plus 153 survey |
| 5% vs 40% | MIT NANDA, 2025 | successful implementation of task-specific tools versus general-purpose LLMs | organisations | ~6 months | correspondence | measured; the gap is in the report's own chart |
| 30% | Gartner, 29 Jul 2024 | generative AI projects abandoned after proof of concept | projects | by end 2025 | process | predicted |
| Over 40% | Gartner, 25 Jun 2025 | agentic AI projects cancelled | projects | by end 2027 | process | predicted; disclosed base is one webinar poll of 3,412 self-selected attendees |
| 60% | Gartner, 26 Feb 2025 | AI projects abandoned unsupported by AI-ready data | projects, conditional subset | through 2026 | process | predicted |
| 28% / 20% | Gartner, 7 Apr 2026 | infrastructure and operations use cases fully succeeding / failing outright | use cases | none | correspondence | measured, n=782 |
| 74% | BCG, 24 Oct 2024 | companies that have yet to show tangible value | companies | none | correspondence | measured, n=1,000 |
| 39% EBIT | McKinsey, 5 Nov 2025 | organisations reporting any enterprise-level EBIT impact | organisations | none | correspondence | measured, n=1,993 |
| 14.5% | Bonney et al. 2024, US Census BTOS | current AI users not expecting to continue | firms | forward-looking | none; an intention | measured, n approximately 164,500 |
| Two to four years | Deloitte, 22 Oct 2025 | self-reported time to satisfactory ROI on a typical use case | use cases | two to four years | correspondence | measured, n=1,854, EMEA only |
| Median Utility Score −0.164 | Wang et al. 2025 | median sepsis model does net harm under full-window external validation | models | at validation | correspondence | measured, systematic review of 91 studies |
Read down the "nature" column. Of the nineteen rows, four are predictions rather than observations, one is unsourced, one is a range of opinions, and one is an intention rather than an outcome. Seven of nineteen widely cited numbers are not measurements of anything that happened. Of the four predictions, three disclose no sample of any kind. The fourth discloses one: a poll of 3,412 self-selected attendees at a webinar, which is not a measurement of the thing being forecast either.
Read down the "unit" column and it gets worse. Organisations, portfolios, projects, use cases, models and opinions all appear, and the popular versions of these figures use the word "projects" for nearly all of them.
3.3 Four structural sources of confusion
The heterogeneity is not random. It has four sources, and each one has a direction: they all push the reported failure rate up.
The silent switch in the unit of analysis. The S&P figure is the cleanest example. Forty-two per cent is the share of companies that crossed a threshold of abandoning the majority of their initiatives. It is cited constantly as "42% of AI projects fail". Those are not the same quantity and cannot be converted into one another without knowing the distribution of portfolio sizes, which nobody publishes.
Deloitte demonstrated the mechanism inside a single survey. In its Q4 2024 wave, two thirds of respondents expected 30% or fewer of their generative AI experiments to scale, while nearly three quarters of the same pool said their most advanced initiative was meeting or exceeding ROI expectations. Ask about the portfolio and you generate a failure headline. Ask about the best project and you generate a success headline. Same respondents, same week. I should say that I have this pairing from a secondary account rather than from the Deloitte report itself, so treat it as illustrative of the mechanism rather than as a verified data point.
Undefined and too-short measurement windows. Deloitte's October 2025 survey of 1,854 respondents finds satisfactory return on a typical AI use case at two to four years, with only 6% achieving payback inside one year. The MIT NANDA report scores success on impact within roughly six months. A study that scores success on impact within six months will classify most on-track projects as failures, by construction, without any of them being in trouble.
This is not an inference. The NANDA report's own limitations section concedes it: the six-month observation period "may be insufficient" and may be "potentially understating success rates" for longer-term implementations. That sentence is in the document. It is in none of the coverage. The most quoted AI statistic of 2025 carries, in its own appendix, a disclaimer that it may be measuring the calendar rather than the projects.
Conditional clauses stripped in transmission. This is the most common failure and the easiest to check. Gartner's 60% applies to projects "unsupported by AI-ready data", which is a conditional subset and supports no statement about AI projects in general. Gartner's 85% is about erroneous outcomes from bias, not about failure. NANDA's 5% applies to task-specific tools, against 40% for general-purpose ones in the same chart. Alegion's 78% is "stall", not "fail". BCG's 74% is "yet to show", which is a statement about timing.
In every one of these cases the primary source carries the limit and the popular version does not. The limit is never wrong in the original. It is removed in transmission, and it is always removed in the direction that makes the number larger and the sentence tidier.
Two further examples are worth having, because they show the same mechanism operating in different directions.
A widely repeated ratio holds that for every 33 AI proofs of concept a company launches, only four graduate to production. I could not find that ratio in any primary document from the analyst firm to which it is attributed, or from the vendor that commissioned the work. What I could verify are regional variants from the same programme: 23 proofs of concept to 3 launches in Asia-Pacific on a sample of 900, and 41 to 5 in Europe and the Middle East on a sample of 620. The ratio is stable at roughly 12 to 13% across all three even though the counts are not, which is reassuring about the underlying finding and says nothing good about the provenance of the version in circulation. Cite it as reported, and give the regional spread.
The other runs the opposite way, and it is the only case in this section where transmission made a claim worse by inverting it rather than by stripping a condition. A well-known analyst formulation is cited constantly as evidence that organisations are adopting AI out of fear of missing out. The primary documents say the reverse: that organisations are moving beyond the fear of missing out, and are no longer driven by it. The trade article most often cited for the phrase does not contain it.
That one is not a rounding error or an over-eager headline. It is a finding reported as its own negation, by people who cited the document.
Sponsor incentive asymmetry. Consultancies and platform vendors have a commercial interest in a problem that is widespread, expensive and organisationally fixable, which is a fair description of every headline in this table. Analyst firms benefit from quotable predictions and are not audited on them. Alegion, whose 2019 survey found that enterprises have training-data problems, sold data labelling. Domino, whose 2026 survey found that governance predicts governed deployment, sells governance tooling.
None of that invalidates the data. All of it should inform weighting, and none of the syntheses I have read do any weighting at all.
3.4 Three demonstrations
Structural criticism is cheap. Here are three places where the artefact is visible in the primary sources themselves, without needing to trust my reading of them.
One research programme, two opposite trends, same year. In January 2025, 451 Research reported that the share of companies abandoning the majority of their AI initiatives before production had risen from 17% to 42% year over year, on a sample of 1,006 midlevel and senior IT and line-of-business professionals across North America and Europe. In July 2025, the same firm reported that respondents gave an average of 24% of projects abandoned prior to production, against 31% the year before, on a sample of 704 IT decision-makers across the US, UK and India.
Abandonment surging and abandonment falling, six months apart, from one research programme. Both can be true: they are different quantities, asked of different populations, in different countries, on different instruments. That is exactly the point. The honest statement is that S&P Global's own AI research produced sharply divergent abandonment trends in 2025 depending on which wave, population and metric you select. Citing the 42% alone as "the S&P finding" is a selection.
I found nothing indicating that S&P reconciled the two.
The category artefact, printed in the report's own chart. The MIT NANDA report's page 6 exhibit shows two series through three stages. General-purpose LLMs: 80% investigated, 50% piloted, 40% successfully implemented. Embedded or task-specific generative AI: 60%, 20%, 5%.
The 95% headline is generalised from the worse of two categories that the report itself distinguishes, on the same page, in a chart. And there is a further problem that nobody has noticed, which I take up in Section 2's discussion of hedge survival: the report's stated success definition is scoped, in its own words, to task-specific tools. It defines successful implementation "for task-specific GenAI tools" as tools that users or executives "have remarked as causing a marked and sustained productivity and/or P&L impact". The 40% figure for general-purpose LLMs has no stated success criterion anywhere in the document. The eightfold gap is therefore a comparison between one number with a subjective definition and one number with none.
The report also computes a pilot-to-implementation conversion rate of approximately 83% for generic LLM chatbots. Note that this cannot be derived from the chart: 40 divided by 50 is 80%, not 83%, and it reconciles at 40 over 48. The chart labels are round tens throughout, so the ~83% is computed off unrounded values the published chart does not show. Quote it as the report's own figure. Do not derive it, because the chart cannot produce it.
The window artefact, with both halves in print. Deloitte finds satisfactory return at two to four years with 6% inside one year. NANDA scores success at roughly six months and concedes in its own limitations that this may understate success. Those two documents, read together, are sufficient to establish that the 95% figure is at least partly a measurement-window artefact. No new research is required. Somebody just had to read the appendix.
3.5 What survives
Stripping out the predictions, the unsourced figures and the transmission errors leaves a short list. These figures mean roughly what they appear to mean, provided their scope travels with them.
Kalinowski et al. (2025) on production rates. A peer-reviewed survey of ML practitioners, 188 complete responses across 25 countries, reporting that 45.27% of ML projects reach production, with a bootstrapped interval of [45.11, 45.44]. The paper phrases it as "less than half". Two conditions travel with it: the estimate is answered by 169 respondents rather than the full 188, and the sample is geographically skewed, with 72 of 188 respondents in Brazil. It is self-reported.
A third condition travels with it that the paper does not state and that this review should apply to its own flagship figure as readily as to anyone else's. The interval runs from 45.11 to 45.44, a third of a percentage point end to end. Sampling variation alone, on a proportion near 45% answered by 169 respondents, would produce an interval several percentage points either side of the estimate. Whatever quantity the bootstrap was computed over, an interval that narrow cannot be read as a statement of how precisely 45.27% locates the population value, and I do not know what it is a statement of. The figure is still the best peer-reviewed production-rate number available and it is still nowhere near 95%. Its third decimal place is not evidence of anything.
The S&P pair, read together. Forty-two per cent of companies abandoning the majority of their initiatives, and 24% average project abandonment falling from 31%, are both usable if you state which is which. Neither is usable alone as "the" abandonment rate.
Gartner's April 2026 infrastructure and operations measurement, with its middle restored. On 782 infrastructure and operations leaders surveyed in November and December 2025, 28% of AI use cases fully succeed and meet ROI expectations, and 20% fail outright. That leaves roughly 52% in a partial-success middle. This figure circulates as "72% of AI projects fail", which is arrived at by adding the partial successes to the failures. It is also scoped to infrastructure and operations use cases, which is not the enterprise.
Deloitte on time to value. Two to four years to satisfactory return on a typical use case, 6% inside a year, n=1,854. Scope condition: this is a survey of 14 European and Middle Eastern countries, fielded between 15 August and 5 September 2025, and it is routinely cited as global.
Bonney et al. (2024) on de-adoption intention. Roughly 14.5% of current AI users did not expect to continue, from US Census Bureau Business Trends and Outlook Survey data covering approximately 164,500 businesses. This is an intention rather than an outcome, and the paper is a working paper rather than peer reviewed. It is nonetheless the largest sample of any figure in this section by two orders of magnitude, and roughly one in seven is a long way from nineteen in twenty.
Wang et al. (2025) on sepsis models. A systematic review of 91 sepsis prediction model studies, in which the median external Utility Score under full-window validation is −0.164. A negative Utility Score means net harm relative to no model at all. This is the most rigorous quantification of AI deployment failure I have found anywhere, and it is in medicine, and I will come back to why in Section 13.
Notice what the surviving list does not contain. There is no figure describing the failure rate of enterprise AI projects in general, because no such figure has been measured. Six scoped, conditional, unit-specific numbers survive, answering six different questions, none of which is the question everybody asks.
So the question "what percentage of AI projects fail?" has not been answered badly. It has not been asked in a form that admits an answer, by anyone, yet.
4. The pre-AI baseline: is this a new failure?
The claim that AI projects fail more than ordinary IT projects has never been tested. Not tested and found true, not tested and found false. Tested at all.
That is a strong statement, so here is what the comparison would require. Two populations, one AI and one not, measured on one outcome definition, by one instrument, over comparable windows, with a stated denominator on both sides. Nothing like that exists. What exists is an AI figure that is a paraphrase of unnamed opinion surveys, and an IT figure that its own field has spent twenty years taking apart.
This section deals with the comparator. The short version is that the IT side is worse than the AI side, and that the critique already written against it is, line for line, the critique the AI failure literature deserves.
4.1 What CHAOS says, and why it cannot bear weight
The Standish Group's 1994 CHAOS Report is the origin of nearly every "most IT projects fail" claim in circulation. Its definitions, verbatim, are worth reading slowly.
Success: "completed on-time and on-budget, with all features and functions as initially specified", at 16.2%. Challenged: "completed and operational but over-budget, over the time estimate, and offers fewer features", at 52.7%. Impaired: "canceled at some point during the development cycle", at 31.1%. It also reports an average cost overrun of 189%, an average time overrun of 222%, and 61% of specified features delivered on challenged projects. The sample is 365 respondents representing 8,380 applications, plus four focus groups totalling 41 IT executives.
Notice what "success" means there. It means the estimate was accurate. A project that delivered enormous value late is a failure. A project that delivered nothing of value, on time and on budget, exactly as specified, is a success.
The series is unstable and the instability is not in the projects. Success runs 16% in 1994, 27% in 1996, 26% in 1998, 28% in 2000, 29% in 2004, 35% in 2006, 32% in 2009, and 29% in 2015 on a changed "modern" definition. Anyone lining those up as a trend is comparing measurements taken with different rulers. Any AI paper that presents 80%, 85% and 95% as a rising series inherits precisely this defect, and several do.
Eveleens and Verhoef made the case against CHAOS in IEEE Software in 2010, and their central claim is stated without hedging: "The Standish definitions of successful and challenged projects have four major problems: they're misleading, one-sided, pervert the estimation practice, and result in meaningless figures."
The four, in their order. Success is defined as estimate accuracy rather than value, and the definitions "don't consider a software development project's context, such as usefulness, profit, and user satisfaction". The definitions are one-sided, neglecting underruns, so an organisation that systematically overestimates scores well. They corrupt the practice being measured: the authors quote Standish's own chairman on 1998 respondents who "had changed their [estimating] process so that they were then taking their best estimate, and then doubling it and adding half again". And the underlying data is unavailable, with Standish having never explained "how it chose the organizations it surveyed, what survey questions it asked, or how many good responses it received".
Then they ran the experiment. They applied the Standish success definition to 5,457 real forecasts across 1,211 projects in three organisations. At Landmark Graphics, which habitually underestimated, the Standish success rate on 121 projects came out at 5.8%. They then built a mirror image of Landmark, every forecast off by the same amount in the opposite direction, and scored it on the same definition: 94.2%.
Same projects. Same size of forecasting error. Reversing its direction moved the headline figure by 88 percentage points, because the definition punishes error in one direction only. (Corrected 11 September 2026: an earlier version said four organisations and described the move as a definitional choice; the definition was held fixed and the bias direction was reversed.)
That is the cleanest demonstration in the entire project literature that a headline failure rate can be an artefact of its definition rather than a measurement of anything. It sits alongside a further finding on the same data: using DeMarco's Estimation Quality Factor, one organisation forecast far better than another (median EQF 6.4 to 6.5 against a median of 1.1, with tenfold to hundredfold overestimation) and yet scored lower on the Standish measure.
Jørgensen and Moløkken-Østvold added the most damaging single item four years earlier, by quoting Standish's own account of how it collected the 1994 data:
"We then called and mailed a number of confidential surveys to a random sample of top IT executives, asking them to share failure stories [!!!]. During September and October of that year, we collected the majority of the 365 surveys we needed to publish the CHAOS research."
The bracketed exclamation marks are the authors'. A sample solicited as failure stories cannot support a population failure rate. That is not a subtle methodological point.
They also found the 189% overrun figure inconsistently defined across Standish's own documents, and an outlier against every comparable study of the period: Jenkins in 1984 reporting 34% across 23 software organisations, Phan in 1988 reporting 33% across 191 projects, Bergeron in 1992 reporting 33% across 89 projects. Their conclusion is that the realistic average is approximately 30%. When they asked Standish for methodological detail, Standish replied that providing it "would be like giving away their business for free".
4.2 The mirror
Every failure mode of CHAOS reappears in the AI failure literature, in the same order, twenty to thirty years later. This is the analytical centre of the section and I would like it to be uncomfortable reading.
| CHAOS defect | The AI literature's exact counterpart |
|---|---|
| Sample solicited as failure stories | Conference-recruited and self-selected practitioner panels; LinkedIn-recruited interviewees |
| Success defined as forecast accuracy inside an arbitrary window | "No measurable P&L impact within six months" |
| Undisclosed method, unavailable underlying data | Proprietary consultancy and vendor reports; paywalled survey instruments; a prediction whose only disclosed input is a webinar poll |
| Definitions changing between editions while the numbers are presented as a trend | 80%, 85% and 95% treated as a rising series when they measure different things |
| A number that corrupts the practice it measures | Organisations gaming their AI adoption and pilot-count metrics |
The equivalent of the Eveleens and Verhoef experiment has never been run on AI failure rates. Take a real portfolio, hold its performance constant, vary the success definition across the taxonomy in Section 3, and report how far the failure rate moves. It requires no new fieldwork, and it would settle a question the field has been arguing about for four years. Section 12 puts it on the research agenda, as one of two items there that need no new data collection at all.
4.3 What a real comparison looks like
There is one piece of work that does properly what the AI literature has not attempted, and it is worth setting out in detail as a methodological standard rather than as a finding.
Flyvbjerg and colleagues published a cross-group comparison of 23 project types in Project Management Journal in 2026: 11,011 projects, 126 countries, a portfolio value of USD 4.64 trillion, one consistent outcome measure, and a stated null hypothesis. The null, in the authors' words: "IT projects are not different from other projects in terms of cost risk." Result: rejected.
Where IT ranks is the interesting part, and it is not where the folklore puts it.
On mean cost overrun, IT is fifth of 23, at 1.73. Above it sit nuclear storage at 3.33, the Olympics at 2.57, nuclear power at 2.20 and hydroelectric dams at 1.75. On the average, IT is bad but unexceptional.
On tail heaviness, IT is worst of all 23, with a Pareto alpha of 0.92, uniquely at or below 1, which means that both the mean and the variance of the distribution are undefined. Nuclear storage is second worst at 1.05. On extreme outcomes, 18.26% of IT projects cost more than 1.5 times their estimate, an overrun above 50%, and the mean overrun ratio within that tail is 5.53, which is 453%. (Corrected 11 September 2026: an earlier version said "exceed a 150% cost overrun"; the paper's threshold is a cost ratio of 1.5.) IT is the only project type of the 23 classified as "Extreme" risk.
So what distinguishes IT is not that it fails more often, or overruns more on average. It is that when it goes wrong it goes wrong without an upper bound.
4.4 The distributional hypothesis
That leads to the single most important fact in this section, and it comes from the same research programme's earlier dataset: 5,392 IT projects completed between 2002 and 2014, worth USD 56.5 billion, across 66 countries.
On the 4,677 projects with a cost-overrun ratio, the mean is 1.8 and the median is 1.0. The standard deviation is 8.5. The minimum is 0.0014 and the maximum is 280.4.
The median IT project comes in on budget.
Read that against every "X% of IT projects fail" claim you have encountered. The gap between a mean of 1.8 and a median of 1.0 is the whole story: the average is produced by a tail, not by the typical project. A power-law fit gives a re-estimated alpha of 2.3 for cost overruns, with 2.6 for effort and 3.3 for schedule, so schedule has the thinnest tail of the three. Because alpha sits between 2 and 3 for cost, the first moment is finite but the variance is undefined.
Now apply that to AI. If AI projects are genuinely different from IT projects, the difference will show up as a fatter tail, not as a higher headline rate, because a headline rate is a statement about central tendency and central tendency is not where IT's distinctiveness lives.
No published AI study reports a distributional shape at all. Not one reports a median alongside a mean. Not one reports a tail index. Not one reports the frequency or the magnitude of extreme outcomes. The entire genre reports rates, and rates are the one statistic that cannot detect the thing that would make AI distinctive.
That is the finding of this section, and it is a negative one: the field has spent four years arguing about a number that could not answer its own question even if it were measured correctly.
4.5 The direct comparison, traced
For completeness, here is the "twice the rate" comparison laid out as a comparison, with the two sides beside each other.
| The AI figure | The non-AI IT comparator | |
|---|---|---|
| Unit of analysis | organisations, pilots, or projects, varying by source | projects |
| Outcome measure | zero P&L return at six months, or erroneous outputs, or unspecified failure | estimate conformance, or cost ratio |
| Sample | conference attendees, LinkedIn recruits, unnamed surveys | varies, partly disclosed |
| Sampling frame | undisclosed | undisclosed to partly disclosed |
| Time window | six months post-pilot | project completion |
| Source of the comparison itself | an unsourced clause in a magazine article | none |
Nothing is held constant. Not the unit, not the outcome, not the window, not the frame. The comparison is not weak evidence. It is not evidence.
4.6 The bracketing pair
Two studies bracket the problem from opposite directions, and read together they establish how much of the reported IT failure rate is definitional.
Eveleens and Verhoef move IT success down by holding organisations to estimate conformance. Varajão and Trigo move it up by defining success as realised use and continued engagement: on 193 completed questionnaires from experienced IT project managers across 500 companies, 90.16% of projects scored above mid-level success and 61.66% achieved the top two levels. They extend the measure past scope, time and cost to deliverable usage at 81.87%, maintenance contracts at 68.39%, new project contracts at 58.03% and client recommendations at 37.82%.
Change the definition from estimate conformance to realised use, and IT project success moves from around 29% on the modern CHAOS definition to over 90% on a comparable population. Both are self-reported, which limits both. The point is not that either is right. The point is that the reported failure rate of IT projects is a function of definition to an extent that swamps any real underlying variation, which means it cannot serve as a baseline for anything.
There is a quieter constraint underneath all of this, from Ewusi-Mensah and Przasnyski in 1995, and it deserves more attention than it gets: "The data suggest that most organizations do not keep records of their failed projects and do not make any formal effort to understand what went wrong or attempt to learn from their failed projects."
If organisations do not keep records of failed projects, no population failure rate is computable from organisational records, for AI or for anything else. Every headline figure in Section 3 is a survey of perceptions, because a survey of perceptions is the only instrument the data environment permits. That is worth knowing before anyone proposes a better survey.
The limitation I am not going to hide
The best IT baseline in existence predates the phenomenon being compared to it.
The Flyvbjerg IT dataset runs from 2002 to 2014. The 23-type dataset is majority twenty-first century but contains no meaningful population of generative AI projects, and could not, given when the projects completed. So when I say that IT's distinctiveness is its tail, I am describing IT projects that were mostly finished before the transformer architecture existed.
That cuts both ways and I am not going to pretend otherwise. It means the comparison cannot be made properly today even by someone doing it correctly. It also means that anyone asserting AI is worse than IT is asserting it against a baseline they have not read, which predates their subject, and which is itself contested by its own literature.
One further data point, offered with its status attached. Bérubé, Giannelia and Vial's Delphi panel reports that six of the sixteen barriers they identified, 37%, did not appear in previous IT implementation studies. That is the only quantified estimate I have found of how much of AI project difficulty is new, it comes from a panel of 18 experts whose ranking did not reach consensus, and the authors themselves note that of the four barriers with low agreement between clusters, only two are AI-specific. It is a straw in the wind and I present it as one.
5. The competing specification: is any of this failure at all?
Before accepting a causal account of why AI projects fail, it is worth asking whether the thing being explained is failure.
There is a named alternative hypothesis. It was published before the current wave of AI failure statistics, it predicts the observed pattern from theory rather than fitting it after the fact, and it now has causal empirical support from establishment-level government data. It is the productivity J-curve, and the failure-rate literature cannot distinguish a failed project from a project sitting in the trough of one.
This section sits before the causal argument rather than after it, because a challenge to whether a phenomenon exists is not a concession to be made late. If it holds, most of what follows describes something else.
5.1 The theory
Brynjolfsson, Rock and Syverson set out the mechanism in 2021. General purpose technologies require large complementary investments in intangibles: business process redesign, human capital, software customisation, new organisational structures. National accounts do not capture those as investment.
During the accumulation phase, measured resources produce unmeasured outputs, so measured productivity growth is underestimated. Later, the accumulated intangible stocks produce measured outputs without appearing as inputs, so measured productivity is overestimated. The path of measured productivity is therefore J-shaped, and the J is a measurement artefact of a real complementarity requirement rather than a real decline in performance.
They quantify it for software: by 2017, adjusted total factor productivity is "over 12.4% higher than measured TFP".
The implication for this review is direct. An organisation two years into AI adoption showing no measured return is the expected observation under this theory. Not a warning sign. The predicted mid-course reading.
5.2 The measurement
McElheran, Yang, Kroff and Brynjolfsson tested it at establishment level in US Census data, using the 2021 Management and Organizational Practices Survey supplement to the Annual Survey of Manufactures alongside the 2018 Annual Business Survey linked to the Economic Census of Manufacturing. Roughly 28,500 establishments and 55,000 firms.
The headline, verbatim: "plants with a one standard deviation more intensive AI adoption tend to be 1.33 percentage points less productive". On profit, "a one standard deviation more AI use causes a loss of about $11 million for the average manufacturing establishment". The abstract describes "causal evidence of J-curve-shaped returns, where short-term performance losses" precede medium-term improvement, with a reversal horizon of roughly four to five years, and with firms that adopted by 2017 showing greater growth in revenue, labour productivity and employment over 2017 to 2021, conditional on survival.
A warning about the other estimate in that paper, because it is the one that will be quoted and it should not be. The instrumental variables specification gives "a one standard deviation increase in AI reduces TFP by 0.59 log points or over 60 percentage points". That is roughly forty times the OLS estimate. It is a local average treatment effect for compliers under a specific instrument, and it does not mean AI cuts productivity by 60%. Quote the OLS. Treat the IV as directionally corroborating and say why you are treating it that way.
A third piece of evidence, weaker in design and useful for its scope. Yu and colleagues classified 4,561 firm-year observations from SEC 10-K filings across 510 unique S&P 500 firms between 2016 and 2025, on a one-to-five adoption scale, validating the classification against Census survey data at a correlation of 0.76 and against transaction data at 0.87. They find a consistent J-curve in margins: adoption scores of 2 to 3 come with margin declines of 2 to 3 percentage points among non-technology firms, while a score of 5 comes with margins 12.6 percentage points higher. The authors state plainly that this cannot be interpreted as causal, and it is a preprint. Take it as a third independent dataset showing the same shape, and nothing stronger.
5.3 What this does and does not undermine
None of this shows that no AI project fails. It shows that the dominant genre of evidence cannot tell the difference.
A survey that asks organisations whether they have seen return from AI, two years in, with no control group and no counterfactual, will record a negative answer from a firm in the trough of a genuine J-curve and from a firm that has wasted its money, and will report both as failure. That is a specification error, and it has a named alternative hypothesis with published counter-evidence, which is a stronger position than most methodological objections enjoy.
The honest counterweight goes here too, because a review that cites only negative results is advocacy. Czarnitzki, Fernández and Rammer report, in a peer-reviewed paper using German firm survey data with both OLS and instrumental variables, "positive and significant associations between the use of AI and firm productivity". The association at firm level is positive.
That sits awkwardly beside high project-level failure rates, and there is an interpretation on which the two are compatible: firms run portfolios and abandon cheaply. A firm with ten AI initiatives, seven killed at low cost and three that work, would show positive firm-level productivity and a 70% project failure rate at the same time. That is an interpretation, not a finding, and I want to be clear which it is.
No paper tests that reconciliation. It is an open question this review poses rather than answers, and Section 12 lists it.
5.4 The tension worth naming rather than resolving
There are two explanations of the same observed non-return and they imply opposite advice.
Brynjolfsson and colleagues say returns lag because the complements take time to build. The advice that follows is to persist and invest in complements.
Acemoglu says returns are small because the task set is small. His calibration gives "no more than a 0.66% increase in total factor productivity over 10 years", and under conservative assumptions "less than 0.53%", resting on roughly 20% of US labour tasks being exposed, roughly 23% of those being profitably performable by AI within ten years, and therefore approximately 4.6% of GDP-weighted tasks being affected. The advice that follows is to narrow the scope and stop expecting transformation.
Two things need saying about that estimate. It is analytical, calibrated with parameters drawn from other studies, and is not itself an empirical estimation, which is not how it is usually cited. And Acemoglu's own caveat is that forecasting AI's macroeconomic effects "is extremely difficult and will have to be based on a number of speculative assumptions".
Most failure reviews implicitly assume the Brynjolfsson story, because the promise that the returns are coming and the complements are worth building is the premise underneath a remedy list. None of them names it, and none names the alternative. If Acemoglu is closer to right, a large share of what the failure literature calls implementation failure is correctly-executed projects addressing tasks that were never going to repay the effort, and no amount of better problem framing changes that.
I do not know which is right. I do know that a review which asserts a causal account of AI project failure without naming this fork is asserting more than its evidence supports.
5.5 Pre-project conditions with a causal design
The same econometric literature contains the closest thing to clean pre-project predictors, and it belongs here rather than in a separate section, because these are conditions that shape the depth of the trough rather than characteristics of successful projects.
Within-firm prior adoption. AI adoption at other plants in the same firm has a "positive and sizable causal effect" on a given plant. Internal precedent is measurable, it is fixed before the project starts, and it is identified with a causal design rather than a cross-sectional correlation. It is the best pre-project predictor I found, and it appears in none of the practitioner frameworks this review examined.
Pre-existing strategic orientation. Firms pursuing market expansion or innovation show significantly lower initial losses. Cost-leadership strategies deepen the dip.
Domain readiness. Zeng, Wang and Sun, working on an unbalanced panel of 20,415 firm-year observations of Chinese listed firms from 2016 to 2022, measure "domain AI readiness" as the co-occurrence frequency of four-digit patent classification codes with AI-related codes, and report that "for firms with the same level of AI capability, those with a domain AI readiness of 1 have labor productivity and total factor productivity that are 3% and 2% standard deviation higher, respectively, than those with a domain AI readiness of 0". The complementarity is driven by external technological evolution rather than by firms' own strategic pivots. It is the cleanest quantitative support I have found for the claim that the pre-existing state of the domain, not the project, conditions value capture. It is Chinese listed firms, on a patent-based proxy, in a working paper that has not been peer reviewed, and all three of those limit it.
And the inversion, which is the most interesting result in this whole area. Losses were "substantially larger in old establishments". The mechanism is not inertia. Older establishments abandoned their structured management practices, their KPI monitoring and production targeting, on adopting AI, and that de-adoption accounts for approximately one third of their productivity losses.
High prior structure was a liability rather than an absorptive advantage, because the AI adoption caused the structure to be dropped. That inverts the standard maturity-model assumption underneath most enterprise AI advice, which holds that organisations with better existing management practice are better prepared. On this evidence they had further to fall, and they fell because they let go of the thing that had been working.
5.6 One error to avoid
Adoption predictors are not success predictors, and the two are routinely conflated.
Firms with "at least one type of information in digital format" were 2 percentage points more likely to report AI use, cloud computing users 5 percentage points more likely, and 57.5% of robotics adopters also used at least one AI technology. Among startups, venture funding raised the probability of adoption by 10.7 percentage points, process innovation by 5.4, patent ownership by 3.5 and advanced degree holders by 1.04.
Every one of those is a propensity to adopt. None of them is evidence that digitised firms succeed more often once they have adopted. The sentence "digitised firms are more likely to succeed with AI" is not supported by any of this, and it is a short walk from what the papers actually say.
There is a final structural point about the whole adoption literature, and it is the authors' own. The best firm-level AI adoption data in existence, reporting that 5.8% of US firms used any AI-related technology in production as of 2017 and 18.2% on an employment-weighted basis, carries an explicit limitation of survival bias: firms that adopted AI and then failed are excluded from the sample.
The best data on AI adoption is structurally blind to the organisations whose AI efforts killed them. That is worth holding in mind through the rest of this review.
6. What the evidence actually supports about causes
Underneath the statistical confusion there is a body of causal evidence, and it is genuinely convergent. Independent methods, independent samples, different countries, different years, and they point the same way: failure is concentrated in problem formulation and data foundation, and every source reads those causes as organisational rather than technical.
That is the good news, and it goes before the qualifications, because the qualifications are extensive and it would be easy to leave the impression that nothing is known. Something is known. It is narrower than its citation implies, thinner than its confidence implies, and almost entirely about a kind of AI that is not the kind everybody is now deploying.
That last clause is the one to carry through the whole section rather than meet at the end of it, so I will state it plainly here and evidence it in Section 6.6. Almost every study below is about predictive machine learning, and most of the fieldwork was collected before ChatGPT was released. RAND excluded pretrained large language models from its scope by design. The post-2023 work on generative AI deployment failure that this review located amounts to three items, not one of them primary fieldwork. Everything in this section should be read as an account of why predictive ML projects failed, offered as the best available evidence about generative AI projects because nothing better exists, and not because anyone has shown that it transfers.
6.1 The convergence
The anchor is Kalinowski and colleagues, published in Information and Software Technology in 2025, and it is the only peer-reviewed source in this area with a coded frequency distribution over failure causes.
The design matters, so here it is before the numbers. 276 respondents, 188 complete responses analysed, across 25 countries. Participants were asked for the top three problems leading to overall project failure, and the authors then, in their words, "conservatively analyzed only the first (most critical) problem reported by the participants", discarding the second and third. That gives 139 open-text answers, one per respondent. Project failure is defined in the paper as "a project that did not result in a released product or was canceled due to not providing the expected results".
The coded distribution:
| Category | Share of coded causes |
|---|---|
| Input: problem understanding, requirements, domain knowledge | 37.41% |
| Data | 33.09% |
| Method | 20.86% |
| Organization | 5.76% |
| People | 1.44% |
| Infrastructure | 1.44% |
Input and Data together are 70.5% of coded causes, against Method at 20.86%.
Three conditions travel with that table and are dropped in every secondary account I have read. First, the percentages are frequencies of occurrence of codes, not shares of respondents, and the paper says explicitly that they "do not represent probabilities". Second, the Organization category at 5.76% is missing from every secondary retelling, which is why the categories are usually presented as five and sum to 94.24%. Third, the sample is geographically skewed, with 72 of the 188 respondents in Brazil.
A fourth thing, which I only found by opening the leaf-level figure. The Input category's largest component is Problem Understanding at 22.3%. But Managing Expectations, at 7.19%, is the second-largest single leaf code in the entire figure, and it is classified under Method, not under Input. Anyone glossing Input as "problem understanding, requirements, expectation management", as I did before reading the figure, has quietly moved the second-biggest leaf across a category boundary.
The independent corroboration. BCG, surveying 1,000 executives across 59 countries, reports that leaders put 10% of their resources into algorithms, 20% into technology and data, and 70% into people and processes. That lands in almost the same place as Kalinowski from an unrelated instrument in a different year, and the coincidence is striking.
It is also not the same kind of claim, and this is exactly the sort of tidy sentence that ought to be treated as a suspect. BCG's 10-20-70 describes how leaders allocate resources. It is a prescription and a description of behaviour. It is not a measured distribution of failure causes. Two numbers landing in the same place from different instruments is interesting; it is not two measurements of one quantity, and presenting it as convergent evidence for a cause distribution overstates it. I use it as corroboration of the direction, not of the magnitude.
The rest of the convergence is qualitative and it is broad.
RAND's interview study, 50 industry and 15 academic interviewees, reports that leadership and data issues "were cited spontaneously by more than one-half of the interviewees", with the other three root causes each cited by "a one-quarter to one-third of the interview participants". Thirty of the 50 industry interviewees named persistent issues with data quality.
Ermakova and colleagues, working from 13 interviews plus 112 experts across 11 industries, rank the top three failure reasons as lack of understanding of business context and user needs, then low data quality (34% critical, 29% significant), then data access problems (30% critical, 24% significant). They also report 54% identifying a conceptual gap between business strategy and analytics implementation, and 49% noting a lack of organisational alignment.
Sambasivan and colleagues interviewed 53 AI practitioners across India, the United States and East and West Africa, and found that 92% had experienced at least one data cascade and 45.3% two or more, where a cascade is defined as "compounding events causing negative, downstream effects from data issues, that result in technical debt over time". Those are prevalences inside a small sample purposively selected for high-stakes AI work, not population estimates, and should be read as such.
Nahar and colleagues, using grounded theory across 45 participants in 28 organisations and member-checking with 10 of them, find that failure concentrates at three organisational collaboration points: requirements and planning, training data, and product-model integration. Seams, not components.
Amershi and colleagues, with 14 interviews and 551 survey responses inside Microsoft, find data availability, collection, cleaning and management ranked first across every experience level.
Bérubé, Giannelia and Vial's Delphi panel ranks lack of understanding of the business potential of AI first and lack of quality data second, out of sixteen barriers. That ranking has to be used carefully, and Section 2 explains why: the panel's own Kendall's W reached only 0.432 after two rounds, which its authors call "a slight improvement, but still somewhat low". What corroborates here is that a framing barrier and a data barrier came out on top together, not the precise order of sixteen items that the panel never agreed on.
Six methodologically independent samples beyond the coded anchor, five countries or more, spanning 2019 to 2024, converging on formulation and data. That is as good as this field gets, and it is genuinely good. It is also attribution rather than causation: not one of these designs tests a mechanism, and Section 6.4 is about how thin the base underneath them is.
6.2 The joint diagnosis, and the distinction nobody has coded
There is a temptation, given the Kalinowski table, to declare a winner: Input at 37.41% beats Data at 33.09%, therefore failure is a framing problem rather than a data problem. I have made that argument myself and it is wrong.
It is wrong because data failures are two different things with opposite remedies.
Suitability failures are purpose-relative. Data quality is not a property of a dataset. It is a relation between a dataset and a purpose. If the purpose is unstated or contested, which is what a framing failure is, then "is the data good enough" has no answer yet. RAND's interviewees state the mechanism directly: "They think they have great data because they get weekly sales reports, but they don't realize the data they have currently may not meet its new purpose." A suitability failure is a formulation failure observed late, and no amount of data engineering fixes it.
Availability and integrity failures are purpose-independent. Missing records, blocked access, corrupt data. These hold whatever the project is for, framing does not touch them, and data engineering is exactly what they are for.
So the honest claim is a joint one: failure is concentrated in problem formulation and data foundation together, and a material share of what is recorded as data failure is purpose-relative and therefore formulation failure arriving downstream.
I want to be precise about what does and does not support that, because this is the point at which it would be easy to write a very tidy sentence.
I opened Kalinowski's leaf-level figure specifically to test it. The Data category's eight leaves are Data Quality 8.63, Insufficient Data 6.47, Data Collection 6.47, Data Preparation 5.04, Data Availability 4.32, Data Complexity 0.72, Data Understanding 0.72 and Data Cleaning 0.72. They do not sort cleanly. The unambiguously availability-side codes reach roughly 10.8% and the unambiguously suitability-side codes roughly 7.2%, which leaves 15.1% in the two largest leaves, Data Quality and Data Collection, that could be either. And "Data Quality" is precisely the term whose purpose-relativity is the argument, so counting it either way begs the question.
Kalinowski did not code for purpose-dependence. That is not a gap in my retrieval. It is the gap. It means the distinction that decides how the field's two largest cause categories relate to each other has never been measured by anybody.
The nearest thing to a coding already exists and nobody has read it this way. Sambasivan's four cascade triggers sort along exactly this line: inadequate domain expertise at 43.4% and conflicting reward systems at 32.1% are organisational causes of data failure, while physical-world brittleness at 54.7% is not. She has effectively performed the coding. Nobody has named it.
So: say that a material share of what is recorded as data failure is purpose-relative, and that no study has ever separated the two. Do not say that Kalinowski shows data failures are mostly framing failures. He does not, and the figure is public.
6.3 What is not a primary cause, which is a finding
Two things the practitioner consensus treats as central turn out not to be, and negative findings from studies that went looking are worth more than positive findings from studies that did not.
Compute is not a constraint. RAND probed this deliberately and reports that "nearly all of the interviewees stated that compute power was not a limiting factor in their work". The exceptions are specific and small: heavily regulated industries that cannot use cloud infrastructure, and large technology companies training their own foundation models. Four of the 50 industry interviewees expected any compute shortage to be temporary as GPU production ramped.
Talent is an amplifier, not a primary cause. Seven of RAND's 50 industry interviewees said talent availability was a difficulty. Nineteen said availability was not a problem overall but that a lack of high-quality talent was a limitation, which is a different claim. In Kalinowski's coding, the entire People category is 1.44% of coded causes, and Lack of Talent/Skill specifically is 0.72%.
Talent is 0.72% of coded project failure causes. Set that against a decade of practitioner writing in which the skills gap is the headline.
Then set it against the National Audit Office's survey of 87 UK government bodies, in which 70% cited difficulty recruiting or retaining AI skills as the most common barrier, ahead of the 62% citing lack of available or good-quality data.
Those two findings are in tension and I am not going to resolve it, because resolving it would require inventing a mechanism. What can be said is that they are different questions asked of different populations. Kalinowski asked practitioners what caused a project to fail, retrospectively, one answer each. The NAO asked organisations what barriers they face, prospectively, in a public sector competing for scarce technical staff against a private sector paying substantially more. A barrier to starting is not a cause of failing. Both can be true, and the popular reading, which takes the barrier survey as evidence about causes, is the one that cannot be.
6.4 The fragility of the convergence
Six independent samples sounds robust. Count the people.
Weber and colleagues: 25 semi-structured interviews conducted between 2018 and 2020, averaging 29 minutes each. Jöhnk, Weissert and Wyrtki: 25 AI experts, 1,385 minutes of interviews, producing a readiness framework rather than a failure study, so using it to explain failure is an inference the authors do not make. Bérubé: 18 panellists. Shankar and colleagues: 18 ML engineers, with saturation reported around interview 16. Schlegel, Schuler and Westenberger: six semi-structured expert interviews conducted in January and February 2021, with no frequency counts reported for any of their twelve failure factors, and any downstream source that ranks those factors has invented the ranking.
That last one deserves a note of its own, because it is cited as two studies. Westenberger and colleagues in Procedia Computer Science in 2022 and Schlegel and colleagues in IJISPM in 2023 are one dataset of six interviews, reported in two venues. They corroborate each other in the way that a photocopy corroborates a document.
RAND, the anchor of the whole field, has its own problems and states most of them. Industry recruitment was by LinkedIn Recruiter and InMail: 379 candidates contacted, 50 participated, 14 declined, so roughly 83% never responded and the response rate is 13.2%. RAND does not list non-response as a limitation. The academic cohort is a convenience sample from conferences and personal networks, 37 contacted and 15 accepted, and it includes graduate students and undergraduate research assistants, which sits awkwardly with the stated five-year minimum experience. "More than 50 unique organizations" is inflated by career history, as RAND's own footnote concedes.
And leadership, data, and the top-down versus bottom-up split were all prompted categories in the interview instrument, not emergent themes. When a study prompts on leadership and then reports that leadership was the most cited cause, the finding is weaker than it reads.
RAND says so itself, in the Methods section: "because the majority of our interviewees were nonmanagerial engineers instead of business executives, the results may disproportionately reflect the perspective of individuals who do not hold leadership positions. Thus, the results may be skewed toward identifying leadership failures."
The headline finding of the most-cited study in the field is disclaimed by its own authors, and the disclaimer travels almost nowhere.
The same applies to the famous 84%. RAND writes that "Eighty-four percent of our interviewees cited one or more of these root causes as the primary reason that AI projects would fail", where "these" refers to four distinct leadership sub-causes: optimising for the wrong business problem, using AI to solve simple problems, overconfidence in AI, and underestimating the time commitment. It is a union across four categories, which mechanically produces a high number. It is not 84% agreeing on one thing. And RAND never states the denominator, although arithmetic makes 50 industry interviewees near-certain, since 84% of 50 is exactly 42.
6.5 Why AI fails differently from IT, if it does
The best available theoretical account is Weber and colleagues', because it explains a mechanism rather than listing symptoms. They identify two distinguishing characteristics of AI systems: inscrutability and data dependency.
Pair that with RAND's observation about timing: "These kinds of errors often become obvious only after the data science team delivers a completed AI model and attempts to integrate it into day-to-day business operations."
That is a late-detection property, and it is specific to systems whose behaviour is not inspectable in advance. A conventional software component can be reasoned about from its specification. A trained model cannot, which means the gap between when a defect is introduced and when it becomes visible is systematically wider, and Section 7 is about exactly that gap.
Amershi's three fundamental differences from conventional software engineering sharpen it: data discovery and versioning are far harder; model customisation requires machine learning expertise rather than programming ability; and ML modules entangle, so module boundaries do not hold and errors behave non-monotonically. That last property is the one that matters most and gets discussed least. In ordinary software, fixing a component improves the system or leaves it unchanged. In an entangled ML system, it may not.
Shankar and colleagues add the operational version, from 18 practising ML engineers: ground-truth feedback delays reported from two weeks to two or three years, and no principled way to set a retraining cadence. If your feedback loop is two years long, your ability to detect that a deployed system has stopped working is limited by arithmetic rather than by diligence.
6.6 Almost none of this evidence is about generative AI
This is the qualification that should worry a reader most, and it is the one I have seen nowhere else.
Sort the evidence base above by fieldwork date where the fieldwork date is recorded, and by publication where it is not. Sculley 2015. Breck 2017, from structured interviews with 36 teams at Google. Amershi 2019. Bérubé's fieldwork October to December 2019. Weber's interviews 2018 to 2020. Sambasivan 2021. Jöhnk 2021. Ermakova 2021. Schlegel's interviews January and February 2021. Nahar 2022. Shankar 2024. Kalinowski 2025.
RAND's interviews ran August to December 2023, and RAND explicitly excluded from scope any project using pretrained large language models without training or customisation. Prompt engineering was out of scope by design.
So the evidence base that the field uses to explain why generative AI deployments fail was assembled to explain why predictive machine learning projects failed, and most of it was collected before ChatGPT was released.
The post-2023 work on generative AI deployment failure this review located amounts to three items, and naming them is the point: the MIT NANDA report, a self-presentation medium with a subjective success criterion and a six-month window; Li and colleagues' scoping review, a secondary synthesis; and Vallone's seven-page review of six grey-literature sources. Not one is primary fieldwork on generative AI projects. That is the entire empirical foundation for the most confidently asserted claims of the last two years.
It might transfer: inscrutability and data dependency both apply to generative systems, and arguably more so. But that is a hypothesis, and the field is treating it as an established base rate.
6.7 Positioning against the field's own synthesis
There is one rigorous synthesis of AI failure research, and this review must say how it relates to it.
Li and colleagues published a scoping review over 141 studies in Business & Information Systems Engineering in October 2025, organising the literature into four clusters across three categories: technical, interactional and ethical. Their own framing is that "existing studies on AI failure remain fragmented".
They and I are doing different things, and the evidence for that is unusually hard.
Their unit of analysis is the AI system. Mine is the AI project. Their reference list is dominated by service recovery after chatbot failure, anthropomorphism, apology strategies, adversarial robustness, explainability and medical-AI liability. It contains no RAND, no MIT NANDA, no Gartner, no Standish, no Flyvbjerg and no Keil. It contains no Kalinowski, no Sambasivan, no Amershi, no Nahar, no Shankar, no Breck, no Sculley, no Ermakova, no Jöhnk, no Weber and no Bérubé. Essentially the entire evidence base of this review is absent from that one, and the overlap is three items.
The positioning sentence I would offer, and I mean it generously: Li and colleagues produce the most rigorous available map of how the AI failure literature cites itself. This review asks whether the claims in it are true.
Two observations about their method, offered in the same spirit. Their four clusters are VOSviewer bibliographic-coupling clusters, derived from shared reference lists rather than from conceptual analysis, and 20 of the 141 documents were unconnected and excluded from the network, so the clusters rest on 121. Their robustness checks are genuine, including re-running with the most-cited author removed to test for a star effect. But a cluster derived from shared reference lists is a structural property of citation behaviour, which is the same point this review makes in Section 2 about seven language models converging: it measures citation-network density, not evidential weight.
The second observation I flag as an observation to be checked rather than a finding, because I have the reference list and not the full study inventory. Their 141 references include both Schlegel et al. (2023) and Westenberger et al. (2022). If both entered the study count as separate studies, then the field's most rigorous synthesis reproduces the double-count identified above. I cannot assert that without the full study list, and I would want to be shown wrong.
One genuine disagreement is worth naming, because it is informative rather than embarrassing. Li and colleagues make ethical failure one of three top-level categories. Bérubé's practitioners ranked ethical issues dead last of sixteen barriers, on the low-consensus ranking described above, so the useful reading is that ethics was nowhere near the top for those practitioners rather than that it was precisely sixteenth. The academic taxonomy and the practitioner ranking disagree about what matters, and that gap is itself a finding about who each literature is written for.
7. Timing: when the fatal decisions were made, and whether anyone could have known
The stage at which an AI failure becomes visible is systematically later than the stage at which its causal conditions were introduced. In the documented cases, the fatal omission always precedes the model. And the set of things that were genuinely unknowable at the time turns out to be very close to empty.
The claim rests partly on borrowed evidence, so the caveat goes first.
No study timestamps the fatal decisions in AI projects. There is no prospective cohort following AI projects from initiation with recorded decision points. There is no stage-gate study applied to machine learning projects. There is no post-mortem study coding causes by lifecycle stage in an AI sample. There is no study establishing whether AI project warning signs were detectable at the time rather than only in hindsight. Everything available on AI project timing is retrospective interview attribution, practitioner template content, or generalisation from non-AI research.
So the transfer from the adjacent literature in 7.2 is an inference, and the case analysis in 7.4 onwards is illustrative rather than a sample. Better to say that than dress nine cases as evidence of a rate.
7.1 Three timelines, not one
Most of this literature treats failure as an event with a cause. That framing is the reason the timing question never gets asked.
A more useful frame, and it comes from the research-design tradition rather than from anything original here, separates three timelines: the causal origin, the manifestation, and the failure recognition. The stage at which failure becomes visible frequently differs from the stage at which its causal conditions originated, and treating them as one point is what produces the persistent finding that AI projects fail "at deployment". They do not fail at deployment. They are noticed at deployment.
This is a conceptual framework, and I want to label it as such. It has not been operationalised in any AI dataset. The one published work that operationalises the causal-history view at all is Johnson and colleagues at FAccT in 2024, which reconstructs 40 cases where stakeholders called for the abandonment of a deployed algorithm as event timelines from public materials. Twenty-four were abandoned; 16 were still in use at publication. They identify six iterative phases, which they label discovery, diagnosis, dissemination, dialogue, decision and death, together with seven socio-technical factors shaping the outcome, including whether the affected people are consumers or unaware subjects, embedding depth in dependent systems, transparency and notice, independent audit access, media visibility, and the regulatory environment.
Its selection bias is itself a finding, and the authors are clear about it. The dataset captures externally contested algorithms and misses the quietly cancelled internal project. Whether the quiet cancellation is the modal failure is unknown, and I can find nothing in this literature that would establish it either way, which is itself the difficulty: the category that no dataset observes is also the category nobody can size. Incident databases capture the contested, not the abandoned. What this literature can see is systematically not what mostly happens, and every base rate in Section 3 inherits that.
7.2 What the general project literature establishes
Two sources do most of the work, and neither is about AI.
Kappelman, McKeeman and Zhang compiled 53 candidate early warning signs of IT project failure and then gathered practitioner ratings to identify a dominant dozen. Two findings are stated in the source and both matter here. The significant symptoms of trouble were "visible early during the project". And all twelve warning signs relate to "People and Process, NOT the Technology itself".
The dozen split evenly. The people-related six: lack of top management support and commitment; a weak project manager; limited stakeholder involvement in requirements gathering; weak project team commitment; team members lacking required knowledge or skills; subject matter experts over-scheduled. The process-related six: poor documentation of scope requirements; an insufficient change control process; ineffective schedule planning and management; communication breakdown among stakeholders; project resources reassigned to higher priority work; a poor business case for the project.
At least seven of the twelve describe conditions substantially determined before the project starts. This is the closest thing in the information systems literature to a timestamped set of causes, and the timestamp is "at or before initiation".
Klakegg and colleagues answer the harder half. Working from a literature review, nine governance frameworks across Australia, Norway and the UK, 14 expert interviews and eight in-depth case studies, their central finding is stated without cushioning: "project professionals are not very good at detecting early warning signs and even less good at acting on them."
On timing, early warning detection matters most "in the initiation or set-up phase", but formal assessments often occur after the critical decision windows have already closed. On detectability, as complexity rises formal assessment loses effectiveness and "the project is increasingly dependent on detecting early warning signs by informal 'gut-feel' approaches", with soft indicators such as culture, communication and trust named as the signals that formal methods consistently miss.
And on why nobody acts, they give a list that is not psychological: optimism bias and political pressure; time constraints preventing reflective analysis; organisational incentive misalignment; group thinking and blame cultures; and the belief that the project will simply run faster to resolve its issues. They conclude that human factors rather than technical limitations are the primary obstacle.
That list is the bridge into Section 9. If the signs are detectable and nobody acts, the interesting question is not detection. It is the incentive to respond.
Flyvbjerg corroborates on the front end, from a different literature: front-end planning is scant, bad projects are not stopped, and the selection distortion happens before the green light rather than during execution.
7.3 What RAND supports for AI specifically, and how far
RAND locates several causes before a project starts. It does so by retrospective interviewee attribution rather than by timestamped record, which is a real limitation and not a fatal one, and I would rather quote it than summarise it.
Problem definition is the most frequently cited failure point in the study, and problem definition is an initiation decision. Data suitability is described as a precondition rather than a task: "They think they have great data because they get weekly sales reports, but they don't realize the data they have currently may not meet its new purpose." Infrastructure is said to need to precede projects, with organisations that move from prototype to prototype "often find that they are completely blind to failures that arise after the AI model has been completed and deployed". And feasibility screening is placed before commitment: "When considering a potential AI project, leaders need to include technical experts to assess the project's feasibility".
Then the sentence that names the gap this whole section is about, in RAND's own words: "These kinds of errors often become obvious only after the data science team delivers a completed AI model and attempts to integrate it into day-to-day business operations."
That is the distance between causal origin and manifestation, stated by the field's anchor study, in a report that does not otherwise treat timing as a variable.
Two other RAND observations describe the same interval from different angles. On churn: "in some organizations, senior leaders rapidly switch their priorities every few weeks or months", against RAND's own recommendation elsewhere in the same report that teams be committed to a specific problem for at least a year. And a category the literature does not otherwise have, in RAND's phrasing: "while these types of projects might succeed in a narrow sense, they fail in effect because they were never necessary in the first place." Success by delivery, failure by necessity. That failure is determined entirely at initiation and is invisible to every execution-stage control.
7.4 The case evidence
Section 8 sets out nine cases in detail. Here is what they say about timing, which is the single clearest pattern in this review.
| Case | Stage of the fatal omission | The omission |
|---|---|---|
| MD Anderson | Contracting, 2013 to 2014 | Payment decoupled from delivery; approval thresholds engineered around; no clinical evaluation ever commissioned by the institution itself |
| Zillow | Problem framing, February 2021 | A present-value estimator assigned to underwrite forward-dated balance-sheet risk, with no spread sized to its own published error |
| Amazon | Label selection, 2014 | Target variable set to past hiring outcomes, in a workforce whose composition was the thing to be avoided |
| Epic | Feature selection and distribution model | Antibiotic orders as a predictor; generic pre-trained shipping that makes local validation nobody's job |
| Home Office visa | Deployment governance, 2015 | No equality impact assessment, no data protection impact assessment, no published logic, for a system taking nationality as an input |
| Ofqual | Objective specification, April 2020 | Aggregate distribution fidelity chosen as the objective; individual fairness left to an appeals process that did not exist |
| DWP | Data collection, pre-deployment | Protected-characteristic data not collected, making the primary fairness question permanently unanswerable |
In every case the fatal omission precedes the model. Not one of these failures was caused by a modelling error discovered during modelling.
The generalisation is worth stating flatly, because it is the practical core of this review: the model is the last place the failure lives and the first place everyone looks. In six of these seven cases, a competent modeller building exactly what was specified would have produced exactly what was produced.
Epic is the boundary case and it should be named as one rather than absorbed into the generalisation. Including antibiotic orders among the predictors is label leakage, and label leakage is a modelling error by any textbook definition, so on the face of it Epic is a case where the modeller did make the mistake. Section 8.4 sets out why I still read it as an upstream decision: the leakage was built into a pre-trained model shipped generically to hundreds of sites, which is a product architecture rather than a project, and the hospitals carrying the risk had no access to the decision. That reading is arguable. A reader who rejects it should treat the generalisation as holding in six of seven cases, which is what I have written, rather than in all of them.
Amazon is the cleanest instance. The model faithfully learned to prefer candidates resembling people Amazon had previously hired, because that is what the label said. In a male-dominated applicant pool, gender proxying is not a defect. It is a correct fit to a biased target. There is no version of that project in which better modelling produces a different outcome.
7.5 Known, mis-remediated, or unknowable
Sorting the cases into three states produces the finding that surprised me most.
Known and ignored. Ofqual, where the Royal Statistical Society raised the specific failure modes in April 2020, restated them to a select committee in June and published a public warning on 6 August, one week before results day. The Home Office visa tool, criticised by the Independent Chief Inspector of Borders and Immigration in February 2020, six months before withdrawal, by the Home Office's own statutory inspectorate. MD Anderson, where contract fees were set just below the Board approval threshold, which cannot be done by accident, and where a board-approved electronic health record migration made the data dependency foreseeable from November 2013. Zillow, whose own published off-market median error of 6.9% sat against a fee structure in the low single digits, on its own website. Amazon after 2015. DWP, where disparities were measured internally in February 2024 and published only after a freedom of information request.
Known but mis-remediated. This is a category the literature lacks and it deserves a name, because I suspect it is the most common state in practice.
Amazon detected the gender skew in 2015, one year in. It acted. It edited the offending tokens rather than changing the training objective, and Reuters records the acknowledgement that this was no guarantee against other discriminatory proxies. Detection worked. The theory of the defect was wrong, so the fix addressed a symptom.
That is not a failure of monitoring, and no amount of better monitoring would have caught it. It is a failure of diagnosis, and every framework that treats detection as the control is silent about it.
The DWP case belongs in this category too, and more sympathetically. The disparity was measured, eventually published, mitigated by human review of every decision and by withholding the risk rating from the reviewing officer, and the model continues in operation on a stated departmental judgement that continuing is reasonable and proportionate. That is a genuine judgement call rather than an obvious error, and I include it because a category that only contains mistakes is not a category.
Genuinely unknowable at the time. Two items, and they fall across six of the seven cases rather than all of them, because Epic belongs to a fourth category set out in 7.6.
The first is the precise timing and magnitude of the deceleration in US house price appreciation in the second half of 2021. The second is the full difficulty, in 2013, of natural-language extraction from unstructured oncology notes, on which Amy Abernethy is quoted in JNCI in 2017: "The M. D. Anderson experience is telling us that solving data quality problems in unstructured data is a much bigger challenge for artificial intelligence than was first anticipated."
That is the entire list of the unknowable. Two items, across six cases involving roughly $62 million of procurement, an $881 million segment loss, 39.1% of a national cohort's A-level grades, a recruiting model built on a decade of a company's own hiring, and a visa system taking nationality as an input. Everything else was either known at the time, or would have been known to anyone who looked, using methods that existed and cost less than the failure.
I want to separate a third state that is often folded into "unknowable" and is not the same thing. MD Anderson could have commissioned its own prospective clinical evaluation of the Oncology Expert Advisor and did not. The system's clinical performance was unknown, and it was unknown because nobody looked. That is a more damning category than unknowable, not a milder one.
7.6 The structural exception
One case in the set involves a genuine information asymmetry, and it is instructive precisely because it is the exception.
Epic's sepsis prediction model was distributed as a pre-trained model inside the electronic health record, and the vendor's performance claim of an area under the curve of 0.76 to 0.83 existed only in internal, non-peer-reviewed documentation. Wong and colleagues describe the structural problem in their own words: "The increase and growth in deployment of proprietary models has led to an underbelly of confidential, non-peer-reviewed model performance documents."
They also note that complex proprietary models "may present insurmountable barriers to local external validation" for hospitals without data science capacity.
That is the sharpest known-versus-unknowable boundary in the set, and the asymmetry was structural rather than accidental. Shipping a generic pre-trained model to hundreds of sites makes per-site validation somebody else's job, and therefore nobody's. It took an outsider with a research department to break it.
There is a coda that makes the point worse rather than better. The independent prospective validation of the revised model, published in JAMA Network Open in February 2026 across four US health systems and 227,091 inpatient encounters, is financially independent of Epic: no author is affiliated with the company and the declared funding is university and National Institutes of Health. It is not informationally independent. The paper left-censors certain prediction scores "per developer recommendation". And the benchmark it improves on, Epic's reported internal validation figures of 0.83 to 0.86 across three sites, is cited in the paper to a Microsoft Teams meeting with two Epic employees on 25 February 2025.
Five years after the phrase "an underbelly of confidential, non-peer-reviewed model performance documents" was published, the vendor's performance claim inside the validating paper is a Teams meeting. Nothing about that is improper and the authors disclosed it correctly. It is simply the same structure, still operating.
7.7 The interval between detection and cessation
If detection were the binding constraint, the cases would show failures running until someone noticed. They do not. They show failures running long after someone noticed.
Epic's negative external validation was published in JAMA Internal Medicine in June 2021. Version 1 of the model was still in production through the whole of calendar year 2023 at two Harris County, Texas safety-net hospitals, where a separate validation across 145,885 encounters found sensitivity of 14.7%, specificity of 95.3% and positive predictive value of 7.6% at a six-hour window, and found that clinicians treated sepsis independently of the alert in roughly half of cases. Two and a half years after publication, in safety-net emergency departments, which is to say among the patients with the least capacity to seek care elsewhere.
Amazon detected bias in 2015 and disbanded the team by the start of 2017.
The Home Office was criticised by its own inspectorate in February 2020 and stopped using the visa streaming tool on 7 August 2020, after the Joint Council for the Welfare of Immigrants and Foxglove filed judicial review proceedings in June. The Government Legal Department's letter of 3 August 2020 is careful to say that "the redesign does not mean the Secretary of State accepts the allegations in your claim form".
Ofqual reversed on 17 August 2020, four days after results were issued, after the appeals criteria published on 15 August were withdrawn within hours and an emergency board meeting on 16 August recorded that issuing centre assessment grades to all students was "becoming the inevitable course".
In four of the six failure cases where cessation occurred, it required external legal or commercial force rather than internal evidence.
Detection is a solved problem relative to response. Every one of these organisations had the information. What none of them had was a mechanism by which holding the information obliged anyone to act on it, and Section 9 argues that this is not an accident of governance but a predictable output of how the work is funded, announced and rewarded.
8. The cases
Nine cases: seven adverse cases and two documented successes. The seven divide, and the division matters enough to carry through the rest of the paper rather than note once. Six are terminated failures: the system was withdrawn, wound down, disbanded or abandoned. One, the Department for Work and Pensions model, is a contested continuing deployment, still in operation, with measured and acknowledged disparities and a departmental judgement that continuing is proportionate.
Earlier drafts of this review called all seven failures and flagged DWP as a partial exception wherever it appeared. That was the wrong way round. Forcing it into the failure category made it the least useful case in the set, when in fact it is the most useful, because it is the only one where an organisation held the evidence, accepted it, and continued anyway. It is the deviant case, and the question it asks is better than the question the other six ask: not why disparities went undetected, but why comparable evidence produced cessation elsewhere and continuation here. Where a claim below holds for the six terminations but not for DWP, the text says six. Where it holds across all seven, it says seven and means it.
Read against each other, the difference between the adverse cases and the successes is not model quality. It is the presence or absence of five conditions that were established before any of the projects began.
Each case is set out the same way: what happened, what was neglected, the point at which it became irreversible, and what signal was visible beforehand and to whom. Corrections to the popular retelling are in the body rather than in footnotes, because several of the corrections are more useful than the cases.
8.1 MD Anderson and the Oncology Expert Advisor
Two distinct systems are routinely merged, and the merger is wrong. MD Anderson's Oncology Expert Advisor was a bespoke build with IBM and PricewaterhouseCoopers. Watson for Oncology was the separately developed product trained at Memorial Sloan Kettering and sold globally. Papers that treat them as one system are in error, and the error matters because the evidence about each is different.
What happened. MD Anderson began building the Oncology Expert Advisor in 2013. The University of Texas System Administration's audit, Special Review of Procurement Procedures Related to UTMDACC Oncology Expert Advisor Project, dated November 2016, became public in February 2017.
The audit reports that "through August 31, 2016, approximately $62.1 million has been paid to external firms for planning, project management, and development of OEA", and its appendix foots to $62,113,459.55. The payments split as $39,185,560 to IBM and $22,927,900 to PwC. Two different component figures circulate because two different quantities are being reported: IBM's contract "has been extended 12 times, with total fees of $39.2 million", and two PwC contracts carry fees of approximately $21.2 million, but contract fees and payments made are not the same measure and only the payments sum to the headline.
The procurement findings, in the audit's own words. "Only one of seven OEA-related service agreements reviewed ($18.75 million, or 27 percent of contract fees) was procured through a competitive process." Of the six non-competitive procurements, carrying fees totalling $51.4 million, two worth approximately $41.7 million lacked a formally approved exclusive-acquisition justification. "Fees were consistently set just below the amount that would have required Board of Regents approval." And: "Invoices were paid in full regardless of whether contracted services were delivered as agreed upon."
The system was never used on patients. "As of September 2016, the system is not in clinical use and has not been piloted outside of MD Anderson." IBM ended support for the pilot and demonstration systems effective 1 September 2016. The in-force agreement itself states that the system "is not ready for human investigational or clinical use, and its use in the treatment of patients is prohibited", except for testing. Pilots ran on the outgoing ClinicStation system and never migrated to Epic.
The correction that matters most, and it is not the one usually made. Every account of this case, including those written by journalists who read the audit in 2017, reports that the audit declined to assess whether Watson worked. That is true. It is not the whole sentence. The audit states, in its own bold: "results stated herein should not be interpreted as an opinion on the scientific basis or functional capabilities of the system in its current state. MD Anderson has engaged an external consulting firm to conduct a review of the system for that purpose."
The clinical assessment was not omitted. It was assigned. The audit names neither the firm nor any output, and I have found no evidence that the review was ever completed or released.
So this is a procurement failure, not a documented clinical one. Sixty-two million dollars bought an artefact whose clinical performance is, on the public record, still unknown. That is a stranger finding than "Watson failed at cancer", which is the version in circulation.
Two further corrections. The often-quoted "$1 billion" sale price of Watson Health is not a disclosed figure. IBM announced on 21 January 2022 that Francisco Partners would acquire its healthcare data and analytics assets; the deal completed on 30 June 2022 and the business launched as Merative. Neither party disclosed terms. The billion traces to Axios, citing unnamed sources, reporting a price IBM was seeking.
And the widely repeated clinical horror story is about the other system. STAT reported in July 2018, working from internal IBM slide decks prepared in June and July 2017, "multiple examples of unsafe and incorrect treatment recommendations" from Watson for Oncology, the signature example being a recommendation of bevacizumab for a 65-year-old man with newly diagnosed lung cancer and severe bleeding, against a black-box warning. Memorial Sloan Kettering stated that this case was part of IBM's system testing and was not given to a real patient, and STAT itself notes no mention that patients were actually harmed. Training used synthetic hypothetical cases, with one or two doctors training each cancer type, and as of July 2017 the training case counts ranged from 635 for lung down to 106 for ovarian across eight cancers.
What was neglected. Procurement control, deliberately: you cannot set seven contract values just below an approval threshold by accident. Acceptance testing tied to payment, so that non-delivery never became a financial event. Integration against a known future state: MD Anderson's board approved a $60 million Epic contract in November 2013 while the Oncology Expert Advisor was being trained against the outgoing system. The organisation bought two incompatible systems in the same year. And independent clinical evaluation, ever, by anyone whose findings reached the public record.
When it became irreversible. At contract structuring in 2013 and 2014, before any model was trained. Once fees were split to avoid board approval and payment was decoupled from delivery, the two mechanisms by which failure would have become visible were both disabled.
Signal. The procurement irregularities were known by construction. The electronic health record migration was a scheduled, board-approved event, so the data incompatibility was foreseeable from November 2013. The clinical performance was unknown because nobody looked, which is a different category from unknowable. Genuinely unknowable in 2013: the difficulty of extracting structured meaning from unstructured oncology notes.
8.2 Zillow Offers
All figures here are from Zillow Group's own disclosures unless stated otherwise.
What happened. On 2 November 2021, in its third-quarter earnings release, Zillow announced the wind-down of Zillow Offers. An inventory write-down of approximately $304 million within the Homes segment, attributed to "purchasing homes at higher prices than current estimated future selling prices". Expected further losses of $240 million to $265 million, primarily on homes already expected to be purchased in the fourth quarter. Impairment and restructuring costs of $175 million to $230 million. The Homes segment recorded revenue of $1.186 billion and a loss before income taxes of $421.6 million in the quarter, against a loss of $59.3 million on $777.1 million of revenue in the second quarter. Full-year 2021 Homes segment loss before income taxes: $881 million, against $320 million in 2020. And "a reduction of Zillow's workforce by approximately 25%".
On the headcount, cite the percentage only. Zillow never gave an absolute number. Contemporaneous reporting gave 2,000 in one outlet and 1,600 of a 6,400-person workforce in another. Both cannot be right and neither is Zillow's figure.
Rich Barton, in the shareholder letter: "We have been unable to accurately forecast future home prices at different times in both directions by much more than we modeled as possible, with Zillow Offers unit economics swinging approximately 1,200 basis points from Q2 to an expected -500 to -700 basis points in Q4."
Note the phrase "in both directions". That is a chief executive conceding that the model was also wrong when it was making money.
The technical point, and it is established from primary sources rather than inferred. Zillow explicitly repurposed a retrospective valuation model as a forward-looking pricing instrument, and announced that it was doing so. On 25 February 2021 it published a release titled "Zillow Starts Making Cash Offers For the Zestimate", making the Zestimate itself the initial cash offer in more than 20 markets. Chief operating officer Jeremy Wacksman: "This exciting advancement demonstrates the confidence we have in the Zestimate."
Now the arithmetic, which was available on Zillow's own website at the time. Zillow's published median error rates were 1.9% for on-market homes and 6.9% for off-market homes. Zillow Offers made offers on off-market homes. A 6.9% median error means half of all offers were wrong by more than 6.9%, which on a $400,000 home is more than $27,600, against a target margin in the low single digits.
Even at its advertised accuracy, and with zero market movement, the model's central tendency of error exceeded the business's entire margin. And the Zestimate estimates present value, while the balance-sheet exposure ran three to six months forward.
The comparison that makes this case worth more than the others, and the correction it needed.
Opendoor was in the same market, in the same quarter, with a larger book. That comparison is the closest thing this literature has to a counterfactual, and the version of it I first wrote was wrong. Setting out why is more useful than quietly fixing it, because the error is the exact one this review is about.
The claim I made was that Opendoor recorded $39 million of inventory valuation adjustment across the whole of 2021 against Zillow's $304 million in a single quarter, and that the market therefore was not the variable. Three things are wrong with it.
The two figures are not the same kind of number. Opendoor's $39 million is a non-GAAP measure, defined in its own filings as the adjustment recorded in the period on homes that remain in inventory at period end. Its audited figure for 2021 is $56 million. Zillow's $304 million is one quarter; its audited full-year 2021 write-down was $407.9 million, of which $211.0 million related to homes still held at year end. Like for like, the comparison is $407.9 million against $56 million on the full year, or $211.0 million against $39 million on homes still held. Both are still large gaps. Neither is the gap I stated.
Opendoor did not record nothing in the quarter that killed Zillow. It recorded $31 million in the three months to September 2021.
And the market caught Opendoor twelve months later. In 2022 Opendoor recorded $737 million of inventory valuation adjustments and a net loss of $1,353 million. In the third quarter of 2022 alone it recorded $573 million and lost $928 million, against Zillow's $304 million and $422 million two years earlier. Measured against the book each was marking, Opendoor at the end of 2022 was in a worse position than Zillow at the end of Q3 2021. DelPrete, who produced the original pricing analysis, wrote a year afterwards that "on a per home basis, each company incurred similar losses" and that "the write-down per home in inventory is nearly identical, showing that both companies were guilty of 'unintentionally purchasing homes at higher prices than current estimates of future selling prices.'"
So the market was the variable. It simply arrived at the two companies at different times.
What survives is narrower, better evidenced, and more useful to this review than the claim it replaces. The two failures were not the same failure.
Zillow's is documented, and it is documented in a federal court order. Ruling on the securities litigation against Opendoor in February 2024, the court distinguished the parallel case against Zillow, and in doing so described what Zillow had done: it "sought to rapidly scale up its iBuying operation in an attempt to catch up to its competitors", and to do that it "devised a plan that it called 'Project Ketchup.'" Under that plan, Zillow "applied systematic overlays to drive up offers well above the pricing indicated by its algorithm and pricing analysts." The court's own restatement: "Zillow purposefully raised its offer prices well beyond those generated by its algorithm."
That upgrades Project Ketchup from the anonymously sourced allegation it was in the contemporaneous reporting to a characterisation in a court order resting on a second court's findings. And it relocates the failure. Zillow's model was not overruled by the market. It was overruled by management, upward, deliberately, to buy market share. Opendoor's later and larger loss is what the same downturn does to a book that was not overridden.
The distinction is between strategic override and market exposure. Only the first is a governance failure of the kind this review is about, and it is the sharper finding: the decisive act was not the model's output but a decision to set that output aside on the way to committing capital.
Two limits on all of this, both of which matter. Opendoor's own account of itself cannot be used as evidence: a court held it adequately pleaded that six of Opendoor's statements about its algorithm were "actionably misleading", and although the case settled with no admission and the claims requiring proof of intent were dismissed, the effect is that Opendoor's description of its own pricing accuracy is contested in a way that disqualifies it here. And the size of an inventory mark is itself model-dependent. Opendoor's net realisable value for any home not under contract is, in its auditor's words, "management's internally developed projected sales price less expected selling costs". The mark is set by the same pricing apparatus whose accuracy is the question. A small write-down is weak evidence of an accurate model, which is a general point about every AI system that grades its own homework.
One further claim, in wide circulation, should be named and discarded: that Zillow removed human review from its offers. No primary or reported source for it could be found. It traces to social media and content-marketing posts. It is a tidy explanation and there is no evidence for it.
What was neglected. Model validation against the decision the model was actually supporting, rather than against eventual sale price. A margin-of-error budget: nobody appears to have set the offer spread as a function of the model's own published error distribution. Any means of distinguishing model skill from market beta, when rising prices in the first half of 2021 made a systematically overbidding model look profitable. Monitoring the offer-acceptance rate, which is a cheap real-time overbidding alarm that existed inside the company. And separating operational from model risk in disclosure.
When it became irreversible. 25 February 2021, the day the Zestimate became the offer at scale across more than 20 markets. Before that, Zillow Offers was a small book with human pricing in the loop. After it, the company was warehousing balance-sheet risk underwritten by a model whose stated error exceeded its margin, on inventory that took three to six months to unwind.
Signal. Zillow's own published 6.9% off-market median error against its own fee structure, which is arithmetic that was in public. Mike DelPrete's August 2021 analysis of over 20,000 transactions from January 2020 to May 2021 against a third-party automated valuation model, finding that iBuyers had moved from paying roughly 98% of AVM in 2020 to Opendoor paying a median of 107.7% in the second quarter of 2021, which he characterised as "a shift from the tight pricing discipline of 2020 to a free-for-all, acquire-at-any-cost strategy". That was published in an industry trade outlet three months before the wind-down. Bank of America research, reported in early November 2021, sampling over 300 Zillow Offers properties and finding Austin homes listed on average 7% below purchase price, with a projected average 2% loss across the sample.
And one internal signal, on which the status has changed since the reporting. Business Insider reported in November 2021, from anonymous sources, on an internal initiative in which one unnamed employee said "We were buying 74 percent of the homes that were asking for an offer. What Zillow Offers executives wanted was a success rate in the 50 percent to 60 percent range." Zillow declined to comment. The specific figure remains anonymously sourced and I treat it as such. The initiative it describes does not: as 8.2 sets out, Project Ketchup and the deliberate upward overlay are described in a federal court order. An anomalously high offer-acceptance rate is the observable signature of systematic overbidding, it is a metric the company held internally in real time, and it is now known that the overbidding was policy.
The most instructive fact in the case is a two-week gap. On 18 October 2021 Zillow suspended signing new contracts, and the stated reason was operational: Wacksman said the company was "operating within a labor- and supply-constrained economy inside a competitive real estate market, especially in the construction, renovation and closing spaces". Two weeks later the reason given was that the model could not forecast prices. Either management did not yet know on 18 October, or it did and did not say. Both are findings.
Correction to the common retelling. "Zillow's algorithm broke" and "the market turned against Zillow" are both unsupported. The Zestimate did not break. It was asked a question it had never been tested on.
8.3 Amazon's recruiting model
What happened. Reuters reported in October 2018 that starting in 2014, a group of Amazon researchers created 500 computer models focused on specific job functions and locations, trained on résumés submitted over a ten-year period, most of them from men, scoring candidates from one to five stars. The tool "penalized resumes that included the word 'women's,' as in 'women's chess club captain'", and downgraded graduates of two all-women's colleges. The bias was discovered by 2015. The team was disbanded by the start of 2017. A successor team was formed in Edinburgh with a focus on diversity.
The 500-models figure is Reuters' reporting sourced to unnamed people familiar with the matter, not an Amazon disclosure.
The contested question, stated precisely, because most retellings collapse it. Reuters' sources said that "Amazon's recruiters looked at the recommendations generated by the tool when searching for new hires, but never relied solely on those rankings." Amazon's own statement is that the tool "was never used by Amazon recruiters to evaluate candidates."
Those are reconcilable if Amazon means the tool was never a formal input to a hiring decision while recruiters informally consulted its output. Amazon has never elaborated.
What a careful paper can assert: Amazon publicly stated the tool was never used to evaluate candidates; Reuters' anonymous sources said recruiters looked at its recommendations. No source establishes that the tool determined or contributed decisively to any actual hire or rejection. The claim that "Amazon's AI rejected women applicants" is unsupported by the record. The verified harm is demonstrated bias in a model's scoring behaviour, not demonstrated harm to identifiable applicants. That is still a serious finding. It is a different finding, and the difference is the kind of thing this review exists to insist on.
When it became irreversible. At problem framing in 2014, before any code, at the moment the label was set to historical hiring outcomes. Every downstream fix was patching a correctly-fitted model of a biased process.
Signal. That supervised models trained on historical human decisions reproduce those decisions' biases was well established in the literature by 2014. This is the cleanest example in the set of a failure fully predictable from first principles at design time. And then, after detection in 2015, the mis-remediation described in Section 7.5. Genuinely unknowable: nothing material. There is no technical surprise anywhere in this case.
8.4 The Epic Sepsis Model
What happened. Wong and colleagues published an external validation in JAMA Internal Medicine in 2021: a retrospective cohort at Michigan Medicine covering 27,697 patients and 38,455 hospitalisations between December 2018 and October 2019, with sepsis in 2,552 hospitalisations, or 7%.
The model achieved an area under the curve of 0.63, with a 95% confidence interval of 0.62 to 0.64, against Epic's claimed 0.76 to 0.83. The paper's own wording on provenance: "substantially worse than that reported by Epic Systems (AUC, 0.76-0.83) in internal documentation (shared with permission)." At the recommended threshold, sensitivity was 33%, specificity 83%, positive predictive value 12% and negative predictive value 95%. "The ESM did not identify 1709 patients with sepsis (67%) despite generating alerts for 6971 of all 38,455 hospitalized patients (18%)."
On alert burden, two figures circulate as though they were one, and they are the endpoints of a series. The paper reports the number needed to evaluate as 8 at the hospitalisation level, then 42, 59, 73 and 109 at 24, 12, 8 and 4 hour horizons. The footnote states the difference explicitly: at the hospitalisation level "each patient would be evaluated only the first time the ESM score is 6 or higher", while for each time horizon "each patient would be evaluated every time the ESM score is 6 or higher". Anyone citing 109 must say it is the repeated-alert, four-hour figure. Anyone citing 8 must say it is the alert-once strategy.
The finding that most undermines the deployment rationale. Of the 1,709 sepsis patients the model missed, 1,030, or 60%, still received timely antibiotics. Clinicians were finding these patients anyway.
The authors, on scale and on consequence: the model was "currently in use at hundreds of hospitals throughout the country", and "the widespread adoption of the ESM despite its poor performance raises fundamental concerns about sepsis management on a national level".
What was neglected. Local external validation before deployment at each of hundreds of sites. A predictor that leaked the outcome: antibiotic orders as an input mean the model partly detects sepsis clinicians have already diagnosed, which is textbook label leakage, in production, at scale. Calibration rather than discrimination alone, with threshold selection left to hospitals holding no local calibration data. Alert-burden budgeting, on a system alerting on 18% of all hospitalisations. And a counterfactual: nobody asked whether clinicians were already catching these patients, and when someone did, the answer was 60%.
When it became irreversible. At the point of commercial distribution as a pre-trained, generically shipped model inside the electronic health record, because that architecture makes per-site validation nobody's job. The specific irreversible design decision is the inclusion of antibiotic orders as a feature: once that is in, retrospective performance overstates prospective utility by construction.
Epic's own 2022 revision confirms the diagnosis by reversing exactly those two decisions. Reporting from corporate documents identifies three changes: Epic now recommends that hospitals train the model on their own institutional data; it moved to a more commonly accepted standard for defining sepsis onset; and it reduced reliance on antibiotic orders as a predictor.
Signal. Antibiotic-order leakage was knowable to the vendor and is not subtle. It was not detectable by customers, by design. And after June 2021 it was known and not acted on: the paper was published, widely covered, and version 1 was still running through all of 2023 in safety-net hospitals. The bottleneck was never detection.
8.5 UK public sector: three systems and a base rate
The Home Office visa streaming tool. Operated from 2015, assigning visa applications a red, amber or green risk rating with nationality as an input, where red-rated applications received more scrutiny and were substantially more likely to be refused. The Joint Council for the Welfare of Immigrants, represented by Foxglove, filed judicial review proceedings in June 2020, alleging unlawful discrimination under the Equality Act 2010 and failure to conduct a data protection impact assessment. On 3 August 2020 the Government Legal Department undertook to stop using the tool pending redesign, with use suspended from 7 August 2020 and an interim process in which "nationality will not be taken into account".
What was neglected was the evidentiary basis itself: no published equality impact assessment and no data protection impact assessment for a system operating since 2015 with a protected characteristic as a direct input, no published accuracy or outcome monitoring by nationality, and a live feedback loop in which nationalities historically producing more refusals were rated riskier and therefore produced more refusals.
It became irreversible at introduction in 2015. A system of that design could not later be shown to be lawful, because the evidence that would have shown it was never created. The absence of the assessment is what made the position indefensible, and that absence was baked in on day one.
The signal came with an official audit trail. The Independent Chief Inspector of Borders and Immigration is reported to have publicly criticised the tool and recommended the Home Office release more detail, describing it as cryptic and calling on officials to demystify it, in February 2020, six months before withdrawal. That is the Home Office's own statutory inspectorate. I have that from reporting of the inspection rather than from the report itself, which is listed as an outstanding retrieval.
Ofqual's A-level standardisation, 2020. The best-documented "signal visible beforehand" case in existence, in any field.
Ofqual applied a Direct Centre Performance model which, in its own interim report, "works by predicting the distribution of grades for each individual school or college", with more weight placed on centre assessment grades "where schools and colleges had a relatively small cohort for a subject, fewer than 15 students when looking across the current entry and the historical data".
From Ofqual's own published A-level infographic, covering 718,000 entries in England: 35.6% of grades were lowered by one grade, 3.3% by two, 0.2% by three and 0.01% by more than three, giving roughly 39.1% downgraded, against 58.7% unchanged and 2.2% raised.
Ofqual's interim report states that "96.4% of final calculated grades are the same as, or within one grade of the CAG submitted". That is a true statement, chosen to describe a distribution in which nearly two in five students were marked down.
The collapse took four days. Results were issued on 13 August. On 15 August Ofqual published mock-exam appeals criteria and withdrew them within hours. On 16 August, between 13:00 and 14:45, an emergency board meeting recorded that issuing centre assessment grades to all students was "becoming the inevitable course". On 17 August the policy was reversed.
The documentary record of the warnings is exceptional. From the Royal Statistical Society's letter of 18 August 2020: in April 2020 the RSS raised technical concerns with Ofqual about systematic upward bias in teacher-assessed grades, uncertainty in student rankings and variability across exam centres, and offered to nominate two distinguished Fellows to Ofqual's technical advisory group. Ofqual responded that it would consider the nominees only under a non-disclosure agreement. The RSS objected that the agreement "would have precluded these Fellows from commenting in any way on the final choice of the model for some years", restated its willingness to serve on better terms, and received no official response. In June it submitted evidence to the Education Select Committee restating the concerns. On 6 August, one week before results day, it published a statement warning about "variability or volatility of exam centre results year-by-year", "especially for smaller subjects or intakes", noting that "rankings are subject to some uncertainty, particularly so for middle-ranked students", and that "only very limited information has been released in advance about the statistical adjustment procedure".
In fairness to Ofqual, its chair disputed the characterisation in a letter of 21 August 2020, arguing that the agreement "does not preclude anyone from commenting on the model. It only precludes the disclosure of confidential information shared within the group", calling it "a normal and entirely ethical mechanism", and noting that once the model was published there was no restriction on comment.
The Office for Statistics Regulation's post-mortem in March 2021 found that "the limitations of statistical models, and uncertainty in the results of them, were not fully communicated", that "there was limited human review of outputs of the models at an individual level", and that "there was, in our view, limited professional statistical consensus".
It became irreversible in April 2020, when Ofqual chose an aggregate-fidelity objective and declined the external statistical scrutiny that would have surfaced the individual-fairness consequence. By 13 August, 39.1% of grades had been lowered and no appeals mechanism existed that could handle the volume. The four days between 13 and 17 August were not decision-making. They were consequence.
The transmission failure is the lesson, and it generalises well beyond examinations. Ofqual's condition for accepting expertise was that the experts pre-commit to silence about the outcome. The organisation treated independent scrutiny as a confidentiality risk to be managed rather than as an error-detection mechanism to be used.
The DWP Universal Credit Advances model. Here the sequence between two documents is the finding.
An internal fairness analysis conducted in February 2024, obtained by the Public Law Project under freedom of information and reported in December 2024, found "statistically significant referral and outcome disparity for all the protected characteristics analysed", covering age, disability, marital status and nationality, while concluding that these did not amount to "immediate concerns of discrimination or unfair treatment". Race, sex, sexual orientation and religion were not assessed.
The department's published fairness assessment of July 2025, covering April 2024 to March 2025, reports that only age could be directly assessed among protected characteristics "due to limited equality data availability"; that non-UK nationals were 2.27 times more likely to be referred than UK nationals; that claimants reporting illness were 0.37 times as likely to be referred; and that several age groups showed notably higher referral likelihood than the 35 to 44 comparator, against a four-fifths rule treating relative likelihoods outside 0.80 to 1.25 as notable. Mitigations include human intervention on every decision and the withholding of risk ratings from the reviewing employee. The conclusion: "It is the department's assessment it remains reasonable and proportionate to continue operating the UC Advances model".
What was neglected is the equality data collection that is the precondition for measuring the thing at all. The department cannot assess race or sex disparity in a system deciding benefit claims, because it does not hold the data. It became irreversible at deployment without equality monitoring.
This is the contested continuing deployment named at the top of the section, and this is what makes it the deviant case rather than a seventh failure. It is not a failed project in the sense the other six are: it is an operating system with measured, department-acknowledged disparities and a departmental judgement that continuing is proportionate. The disparity was measured, the measurement was not volunteered, and the response was mitigation plus continuation. Contrast the visa case, where litigation forced suspension.
The base rate these three sit inside. The National Audit Office surveyed 87 government bodies as at autumn 2023. Thirty-seven per cent had deployed AI, with 74 use cases in total, and 70% were piloting or planning. Seventy per cent cited difficulty recruiting or retaining AI skills as the most common barrier and 62% cited lack of available or good-quality data. Only 21% had an AI strategy. Only 30% had risk and quality assurance processes explicitly incorporating AI risks. Only 13% were "always" compliant with the Algorithmic Transparency Recording Standard.
The Committee of Public Accounts reported in March 2025 that 21 of 72 high-risk legacy systems still lacked remediation funding; that only 33 records existed on the government's algorithmic transparency website by January 2025; that around 50% of advertised civil service digital roles in 2024 went unfilled, against a 35% pay gap with the private sector for technical architects; and that no mechanism exists for spreading learning across government AI pilots.
Individual failures should be read against that base rate. Four to five years after the visa and Ofqual failures, the controls whose absence produced them were still absent in most departments. These are not accidents. They are the expected output of the observed control environment.
8.6 Two successes
MASAI, AI-supported mammography screening in Sweden. The interim safety analysis, published in The Lancet Oncology in August 2023, covered 80,033 women aged 40 to 80, using a commercial vendor product evaluated by parties who did not sell it, funded by the Swedish Cancer Society, the Confederation of Regional Cancer Centres and Swedish governmental research funding rather than by the vendor. Cancer detection was 6 per 1,000 screened against 5 per 1,000 for standard double reading, 41 additional cancers, with recall at 2.2% against 2.0% and a false positive rate of 1.5% in both arms, and 44% fewer radiologist screen readings.
The lead author's caution at the interim stage is the point of including this case: "These promising interim safety results are not enough on their own to confirm that AI is ready to be implemented", with primary-outcome results "not expected for several years".
The primary outcome was announced in January 2026. Over 100,000 women randomised between April 2021 and December 2022, 53,043 in the AI-supported arm and 52,872 in the control arm. Interval cancers reduced by 12%, at 1.55 per 1,000 women against 1.76 per 1,000. Eighty-one per cent of cancers detected at screening against 74%; 16% fewer invasive cancers; 21% fewer large cancers; 27% fewer aggressive subtypes. False positives essentially unchanged, at 1.5% against 1.4%. The authors state their limitations: a single country, one device type, one AI system, experienced radiologists only, and no race or ethnicity data.
One condition on my own reporting: the MASAI figures here come from journal-issued press materials carrying journal-supplied numbers rather than from the papers themselves, and confidence intervals for the primary outcomes were not in those materials.
Kaiser Permanente's Advance Alert Monitor. Published in the New England Journal of Medicine in 2020: 19 hospitals, August 2016 to February 2019, staggered implementation with intervention and comparison cohorts, 548,838 non-ICU hospitalisations across 326,816 patients, of which 43,949 reached the alert threshold. The primary outcome, mortality within 30 days after alert, gave an adjusted relative risk of 0.84, with a 95% confidence interval of 0.78 to 0.90 and p less than 0.001.
The implementation detail is as important as the result. Alerts route to "an off-site, virtual team of specialized, highly trained registered nurses" who review the record and then contact the bedside rapid response team nurse, with roughly 12 hours of lead time. The output has an owner.
The honesty caveat that matters for the argument: the evaluation was conducted by Kaiser's own Division of Research. It is peer-reviewed with a contemporaneous comparison cohort, which is far stronger than anything in the failure cases, but it is not external validation in the sense that the Epic study is. And Kaiser's separate public claim about deaths prevented per year is institutional self-report and should not be cited as a measured finding. The measured finding is an adjusted relative risk of 0.84.
8.7 What the successes had
Five things are present in both successes and absent in every failure. Two things have to be said before the list rather than after it, because the list is quotable and the qualifications are not.
The first is sample size. Two successes are not a sample, Section 10.1 says so at greater length, and nothing below identifies a cause.
The second is a confound I cannot rule out and did not initially see. Both successes are clinical, and every item on the list is standard practice in clinical research. Pre-specified primary outcomes, comparison arms, evaluation independent of the manufacturer, staged commitment against interim data: that is a description of a trial protocol. It is entirely possible that these five conditions are not properties of AI projects that succeed but properties of the research culture that medicine happens to bring to anything it evaluates, and that the real finding is about the sector rather than about the technology. The two readings make the same prediction about these two cases and different predictions elsewhere, which is what makes the distinction testable and what makes it unresolved here.
I looked for commercial or public-sector AI successes documented to a comparable standard and did not find any, which is itself informative: the evaluation apparatus that produced these two case records barely exists outside medicine and regulated finance. Section 12 puts the matched comparison on the research agenda. Until someone runs it, the honest reading of the list below is that these five conditions distinguish evaluated projects from unevaluated ones, and that whether they also distinguish successful projects from failed ones is a hypothesis.
A pre-specified primary outcome that could come out negative, chosen before deployment. MASAI pre-registered interval cancer rate, a metric that could have condemned the system. Kaiser pre-specified 30-day mortality after alert. Zillow, MD Anderson and Epic-at-hospitals had no pre-specified failure criterion at all.
A comparison arm. Both successes built one. None of the failures had one. Zillow's nearest comparison existed only because Opendoor happened to exist, and 8.2 shows how much work it took to read it correctly. Epic's became visible only when someone asked what happened to the patients the model missed.
Evaluation funded and executed by people who did not sell the system. MASAI evaluates a commercial product on Swedish public research funding. Epic's 0.76 to 0.83 came from Epic's own internal documents.
A defined human workflow that owns the output. Kaiser's alerts go to a named remote nursing team with a written escalation protocol. Epic's alerts went to whoever was there, on 18% of all hospitalisations, with no owner. Ofqual's outputs went straight to students, with an appeals process improvised afterwards.
Staged commitment. MASAI published safety at 80,000 women before claiming benefit at 100,000, with the lead author explicitly refusing to declare readiness on interim data. Zillow went from pilot to Zestimate-as-offer across more than 20 markets in a single announcement.
None of those five is a technical property.
8.8 Cross-case synthesis
Three observations hold across the whole set.
The failures had no counterfactual and the successes did. Both successes built a comparison arm before they needed one. None of the failures could answer "compared to what?" until an outsider constructed the comparison after the fact: an academic team for Epic, the 60% of missed sepsis patients who received timely antibiotics anyway, and for Zillow a competitor who happened to be running the same experiment. Section 8.2 shows what a comparison assembled after the fact is worth: I got it wrong on the first attempt, in the direction that made the tidier sentence, and it took court filings and both companies' later accounts to correct it.
Rising-market success is indistinguishable from model skill, and organisations reliably choose the flattering reading. Zillow's Homes segment lost only $59.3 million in the second quarter of 2021 while systematically overbidding, because the market marked the inventory up faster than the model was wrong. Barton's "in both directions" is a rare public admission of it. The same structure recurs in the Epic case, where antibiotic-order leakage produced retrospective areas under the curve of 0.76 to 0.83 that were real numbers describing a useless capability. And it recurs, in a form worth watching for, in any system that grades its own homework: the size of an inventory write-down is set by the same pricing model whose accuracy is in question, so a small write-down is weak evidence of an accurate model.
The interval between detection and cessation is where the damage compounds, and it is governed by nothing. Section 7.7 sets out the intervals. Use stopped in six of the seven cases, the DWP model being the exception, and in four of those six stopping required external legal or commercial force rather than internal evidence.
And one further observation, which is the practical thesis of this review. In six of the seven adverse cases here, Amazon being the exception because no source establishes its model decided anything, the decisive moment was not the model's output but the point at which that output was converted into an irreversible organisational commitment: capital deployed on a house that could not be unbought, a grade issued to a student, an alert fired on a ward, a visa application streamed to heavier scrutiny, a benefit advance referred for extra scrutiny, an invoice paid in full.
That suggests the highest-leverage intervention is not improving the model. It is inserting a deliberate procedural checkpoint between AI output and irreversible action. It is derived from these cases rather than borrowed from a framework, and Section 11 develops it.
9. Second-order causes: why the advice does not take
"Define the problem properly, fix your data foundation, secure executive sponsorship." That has been the standing advice for a decade. It is correct. Organisations continue not to follow it.
The failure literature explains this, when it explains it at all, as ignorance or immaturity. Neither survives contact with the fact that the advice is a decade old, repeated in every framework this review examined, and free. The better explanation is that announcing an AI initiative and completing one are separately compensated, and that the reward for the first arrives before the punishment for the second.
This section has a different evidentiary status from every section before it, and the reader should know that at the start rather than discover it at the end. Each component below is separately evidenced, several of them well. The assembly is mine. No study tests these mechanisms together, on AI projects, as a system, and the section ends by saying so again. Read what follows as the most defensible explanation I can construct for a real and otherwise puzzling pattern, not as a finding of the kind Sections 3, 6 and 8 report.
9.1 The wrong default
The failure literature attributes selection error to optimism bias with near-total consistency. Expectations were inflated. Leaders were over-optimistic. Everyone underestimated the difficulty.
There is a competing account with a better empirical record, and there is a stated test for choosing between them.
Flyvbjerg, Holm and Buhl studied 258 transportation infrastructure projects worth approximately US$90 billion in 1995 prices, across 20 countries, completed between 1927 and 1998. Costs were underestimated in 86% of projects. Average cost overruns ran at 44.7% for rail with a standard deviation of 38.4, 33.8% for fixed links with a standard deviation of 62.4, and 20.4% for roads with a standard deviation of 29.9.
The finding that matters is what happened over seventy years: "cost underestimation has not decreased over time. Underestimation today is in the same order of magnitude as it was 10, 30, and 70 years ago."
Their conclusion, verbatim: "underestimation cannot be explained by error and seems to be best explained by strategic misrepresentation, i.e., lying."
Error corrects. Lying does not. That is the discriminating test, and it is empirical rather than psychological. Optimism bias is an unconscious cognitive predisposition, so estimates should improve as experience accumulates and feedback arrives. Strategic misrepresentation is a deliberate decision to overestimate benefits and understate costs in order to secure approval, so estimates do not improve, because improving them would defeat their purpose.
Flyvbjerg's own determinant of which mechanism applies is the level of political and organisational pressure, not psychology. Where pressure is low, optimism bias explanations hold. Where it is high, strategic misrepresentation dominates.
Apply that test to AI. The rest of this section establishes that the pressure is high, measurable and externally observable. On Flyvbjerg's own criterion, strategic misrepresentation should dominate optimism bias in AI project selection.
That inverts the failure literature's default attribution, and it changes what a remedy would have to do. You cannot debias a decision that is not the product of a bias.
There is also a structural point specific to AI. Public works have one misrepresentation channel: the promoter who wants the project approved. AI has several. Vendors, hyperscalers, consultancies and capital markets all benefit from optimistic AI forecasting, which is not true of optimistic road costing.
9.2 The measured payoff separation
The strongest evidence that announcing and doing are separately compensated comes from finance rather than from information systems, and it uses an external measure rather than self-report.
Li defines an AI washing incident as a case where "a firm announces forward-looking AI investment plans but undertakes zero AI-related workforce capacity within the subsequent two years". That definition is the methodological contribution: the test of whether a firm did the thing is whether it hired the people to do it, measured against more than 75 million external résumé records rather than against what the firm says about itself.
The dataset is 20,135 firm-quarter observations across 721 unique US public firms, from the first quarter of 2016 to the second quarter of 2024, combining earnings call transcripts, résumé data, patent data and mutual fund holdings.
The results separate cleanly. "AI walk is associated with roughly 17% more AI patents, 25% higher patent value, and 33% more citations. AI Talk has no significant association with any innovation outcome." On market reaction, talk earns 0.2 basis points higher three-day cumulative abnormal returns per standard-deviation increase, and shows significant 360-day underperformance with a coefficient of −2.520, while walk yields 25 basis points higher buy-and-hold abnormal returns. One hundred and sixty-five firms had at least one incident, peaking at nearly 30 episodes in a single quarter in early 2022. Institutional investors, particularly AI-focused funds, reduce holdings within three quarters of detecting talk without walk.
The honest limit, and it should be stated before the conclusion rather than after it. The short-run effect is small and the market corrects within a year. The strong version of this argument, that AI washing pays, is not supported by this evidence. What is supported is a timing claim: the reward is immediate and diffuse, the punishment is delayed and attributable to market conditions, and that timing is misaligned with executive tenure and reporting cycles. That is a weaker claim and it is the one the data will carry.
This is also a working paper rather than a peer-reviewed publication, and I flag it because the review's own standards require it.
A second paper sharpens the mechanism. Blades, Bilinski and Kraft use the launch of ChatGPT as an exogenous shock and find that "on average, analysts and investors do not differentiate between Speculative firms and those with concrete AI disclosure, evidenced by comparable revisions to target prices and stock price performance". Only more experienced analysts systematically assign lower target prices. They find no evidence that speculative firms receive greater AI ETF inclusion, increased coverage or higher trading volumes.
So the market's default screening of AI claims fails, and whatever discrimination exists depends on individual analyst experience rather than on any institutional mechanism.
A source to avoid, and naming it is part of the contribution. The widely circulated claim that companies mentioning AI in earnings calls saw average stock increases of 4.6% against 2.4%, with 67% seeing increases and 366% growth in AI mentions in the second quarter of 2023, originates from a commercial stock research site and was picked up by the technology trade press in September 2023. It circulates as though it were academic finance. It is not. Use Li instead.
9.3 The regulator's own category
By 2024 the misrepresentation of AI capability was common enough to have acquired its own enforcement category. That establishes that the behaviour exists, that it is prosecutable, and that it became salient enough to be worth a regulator's attention. It does not establish that it pays, and Section 9.2 has already declined to claim that it does.
In March 2024 the Securities and Exchange Commission charged two investment advisers with making false and misleading statements about their use of artificial intelligence. Delphia was penalised $225,000 for false and misleading statements between 2019 and 2023 in filings, press releases and website content, including a claim that its technology could "predict which companies and trends are about to make it big". Global Predictions was penalised $175,000 for 2023 website and social media claims, including falsely representing itself as the "first regulated AI financial advisor". Gurbir Grewal, then Director of Enforcement: "If you claim to use AI in your investment processes, you need to ensure that your representations are not false or misleading."
In June 2024 the SEC charged the founder of the AI hiring startup Joonko with defrauding investors of at least $21 million, on allegations including claims of more than 100 customers, over 100,000 active job candidates, fabricated testimonials, revenue misrepresented as exceeding $1 million, and falsified bank statements and forged contracts.
Grewal on that one: "We allege that Raz engaged in an old school fraud using new school buzzwords like 'artificial intelligence' and 'automation.'"
That is the best sentence in the enforcement record for this argument, and it is worth taking literally rather than as a quip. The buzzwords are new. The structure is not. An enforcement category exists because the behaviour is profitable enough to be worth prosecuting.
9.4 Agent washing, and the irony worth sitting with
Gartner's June 2025 release defines agent washing as "the rebranding of existing products, such as AI assistants, robotic process automation (RPA) and chatbots, without substantial agentic capabilities", and estimates that only about 130 of the thousands of agentic AI vendors are real. Anushree Verma, quoted in the release: "Most agentic AI projects right now are early stage experiments or proof of concepts that are mostly driven by hype."
I could find no independent corroboration of the 130 figure. Every subsequent source repeating it traces back to this single release. Gartner publishes no methodology for the estimate and none for the accompanying prediction that over 40% of agentic AI projects will be cancelled by the end of 2027. The only quantitative input disclosed anywhere is a January 2025 webinar poll of 3,412 self-selected attendees.
The most-cited evidence that vendors overstate AI capability is itself an unmethodologised vendor claim, with a webinar poll as its base and a hard cancellation rate as its travelling number.
I do not say that to score a point: the substantive claim may well be true, and Section 9.3 gives independent reason to think something like it is. The point is that a field which cannot check its own most quoted number about unverifiable claims has a general problem, not a Gartner problem.
9.5 The bad news does not travel
There is a mature information systems research programme, running roughly from 1995 to 2015, on why organisations continue funding projects that are already known internally to be failing. It has never been applied to AI.
Keil's longitudinal case study of an expert system project inside a large computer manufacturer, running from the early 1980s to the end of 1992 and spending approximately $15 to 20 million annually by 1991, rests on 197 interviews with 111 individuals, observation of 19 meetings and more than 350 historical documents. It identifies four categories of factor promoting escalation: project factors including a large potential payoff, research-and-development framing, and setbacks perceived as temporary; psychological factors including prior success and personal responsibility; social factors including competitive rivalry, the need for external justification and norms of consistency; and organisational factors including strong project champions, empire building and slack resources.
Keil, Mann and Rai surveyed information systems audit and control professionals, and did something the AI literature has never done: they deliberately designed the study to gather data on non-escalated projects as a comparison baseline. They report that "between 30% and 40% of all IS projects exhibit some degree of escalation", that escalated projects had significantly worse implementation and budget performance, and that a completion-effect model correctly classified over 70% of both escalated and non-escalated projects.
Keil and Robey, from 42 interviews with information systems auditors yielding 39 usable cases, identify seven factors that significantly promoted de-escalation: reduced tolerance for failure in the organisational culture; publicly stated resource limits; awareness of problems; clarity of success and failure criteria; outcome-oriented performance evaluation; regular project evaluation; and separation of the approval decision from the evaluation decision. And their structural finding: "In the majority of cases, de-escalation was triggered by actors such as senior managers, internal auditors, or external consultants."
De-escalation is almost always triggered from outside the project, which is the same pattern Section 7.7 found in the cases.
On reporting, Keil and colleagues summarised a decade of studies in MIT Sloan Management Review, finding that project managers "write biased reports 60% of the time", with optimistic bias twice as likely as pessimistic, and only about 10 to 15% of biased status reports turning out to be accurate. I obtained those figures from a secondary copy rather than from the journal directly, so treat them as reliable but not first-hand.
The concepts underneath are the mum effect, that bad news fails to travel up or is distorted on the way, and the deaf effect, that it is not acted on when it arrives. Note that the mum effect paper most often cited is a theory-development paper rather than an empirical one, which is worth knowing before citing it as a finding.
Now the amplification, which I state as a hypothesis rather than as a finding, because no application of this work to AI projects exists.
AI supplies more of every input the escalation mechanism needs.
Information asymmetry is higher, because model performance is legible only to the team that built it. Success criteria are less clear, and clarity of success and failure criteria is one of the seven things Keil and Robey identify as enabling de-escalation, so vagueness disables the mechanism directly. Research-and-development framing, which Keil names explicitly as an escalation-promoting project factor, is the default framing for AI work. External justification pressure is high, because AI programmes are announced to markets and boards, which Section 9.2 measures. And the external triggers of de-escalation are weakened, because internal auditors and external consultants are less able to evaluate an AI system than a conventional one.
Five conditions, each independently established in the pre-AI literature, each intensified by AI. If that is right, escalation rates in AI projects should exceed the 30 to 40% baseline. Nobody has measured it, and the instrument for measuring it already exists.
9.6 Selection, not competence
The sharpest formulation of the second-order question is Flyvbjerg's "survival of the unfittest".
Cost underestimation and benefit overestimation together produce what he calls a "distorted hall-of-mirrors in which it is extremely difficult to decide which projects deserve undertaking". The consequence is not that bad projects sometimes get through. It is that the projects which look best on paper are systematically the worst in reality, because looking best on paper requires carrying the largest estimation errors.
That is a selection explanation rather than a competence explanation, and it is the missing piece in the standard review.
Organisations do not keep choosing the wrong AI problem because they are ignorant of the advice. They choose it because the selection process favours the proposals with the largest estimation errors, and the AI proposals with the largest estimation errors are also the ones that read best in a board deck and on an earnings call. The same properties that make a proposal win internally are the ones that make it lose later, and the winning and the losing are not observed at the same time.
9.7 What is asserted, and what is evidenced
The rest of this section is synthesis, and labelling it as such is the point.
Institutional theory is the right frame and the direct test has not been run. DiMaggio and Powell's account of institutional isomorphism gives the correct shape: organisations adopt practices for legitimacy, not only for efficiency. Abrahamson's work on management fashion arguably fits AI better still, because it names the supply side, a fashion-setting community of consultants, gurus, business media and business schools supplying rhetoric that satisfies managers' need to appear rational and progressive. I have located that work rather than read it, and say so.
The closest peer-reviewed empirical work is Granados, Ayala and Ramos-Mejia on innovation theatre, which theorises that organisations enact "hybrid and internal symbolic activities that have no impact on the innovation process but are highly visible" for external legitimacy, across three driver categories of hard, soft and legitimacy pressures. It is inductive and qualitative, not a large-N test.
One recent paper deserves careful handling because it looks like the missing test and is not. Rodriguez Müller, Tangi and Lerusse ran a randomised between-subjects vignette experiment on public managers in Belgian municipalities, inviting 8,401 and analysing 497 after excluding 338 of 835 valid responses for failing an attention check. They find that all three institutional pressures raise stated willingness to adopt AI: mimetic strongest with a Cohen's d of 0.40 at p=0.001, coercive at d=0.28 and p=0.030, and normative weakest at d=0.22 and p=0.088, which is marginal rather than significant. Main effects explain very little variance, with an R-squared of 0.025. Their moderation result runs opposite to their own hypothesis: institutional pressures matter less, not more, for managers who already rate AI positively.
It is a good paper and it does not test what this section needs. The dependent variable is stated willingness to adopt, not adoption, and not a motive. There is no legitimacy measure, no efficiency measure and no contrast between them. Efficiency is held constant across all four arms, including the control, by design. The authors themselves name the legitimacy contrast as future work, and describe their own limitation as measuring "adoption intentions rather than actual implementation".
So the claim stands, narrowed: there is no large-N empirical test of whether organisations adopt AI for legitimacy rather than for efficiency. What exists is causal evidence that institutional cues raise stated intention to adopt, which is a necessary condition for the legitimacy account and nothing like a demonstration of it.
Consultancy demand inflation is evidenced in one setting and generalised in none. Sturdy and colleagues, using four years of English NHS data, find that "using consulting services is associated with demand inflation and has negative implications for client organizational efficiency". That is large-scale, longitudinal, peer-reviewed, and set where spend data is observable. Generalising it to private-sector AI procurement is an inference and I label it as one.
On pilot-friendly contracting and procurement incentives specifically, no academic evidence exists. Everything I found was vendor content. The defensible move is to derive the argument from demand inflation plus the announcement-deployment separation, and to say plainly that the derivation is mine rather than the literature's.
The assembled picture, then, is this. External reward for announcement independent of deployment is measured. Internally directed symbolic activity is theorised and observed qualitatively. Adviser use inflating its own demand is measured in one sector. And the bad news existing at the bottom, being distorted on the way up, and requiring an external trigger to act on, is established across a decade of studies.
Every component is evidenced. The assembly is mine, and the assembly is the part a reader should push back on.
10. What the survivors had: pre-project conditions
The literature examines what failing projects did wrong during execution. The more useful question is what was already true before the project started, and the honest answer is that almost nobody has looked.
This section is short because the evidence is thin, and its headline finding is a negative one.
10.1 The design problem
No matched-sample or control-group study exists comparing organisations that succeeded with AI against organisations that failed, holding pre-project conditions constant. I searched for one specifically. The entire practitioner failure literature rests on failure-only samples, cross-sectional self-report, or vendor surveys. The only designs in this area with credible identification are the Census Bureau econometric papers in Section 5, and those measure adoption and productivity rather than project success.
A failure-only sample cannot establish a cause. It can only establish what failing projects had in common, which includes everything that all projects have in common. If 80% of failed AI projects lacked a clear business owner, and 80% of successful ones also lacked one, the first figure is worthless and no study in this literature is capable of producing the second.
That absence is the section's finding, and it is publishable on its own. Any study of AI failure with a matched success sample would be the strongest design this field has produced.
10.2 What the case evidence gives
Section 8.7 sets out five conditions present in both success cases and absent in every failure: a pre-specified primary outcome that could come out negative; a comparison arm; evaluation by people who did not sell the system; a defined human workflow owning the output; and staged commitment.
Two success cases is not a sample and I am not going to pretend otherwise. There is also a confound that Section 8.7 sets out and that this section inherits whole: both successes are clinical, and all five conditions are ordinary clinical research practice, so they may describe the evaluation culture of medicine rather than the preconditions of AI success. These five are hypothesis-generating, not tested. What makes them worth stating anyway is that all five are observable before a project starts, none requires a technical capability the organisation does not already have, and none appears as a gate in any of the frameworks examined here. They are candidates for the matched-sample study that does not exist, and they are specific enough to be falsified.
10.3 The governance claim, audited
Governance maturity is a heavily emphasised pre-project condition in practitioner writing, and the evidence for it is worse than it looks.
Domino Data Lab's 2026 enterprise report, surveying 639 senior AI leaders at director level and above in organisations with revenues over $100 million, fielded by an independent research firm, reports that organisations with fully integrated governance have 67.5% of agentic AI in governed production against 17.2% for partial governance. That is a 3.9-fold multiplier, and the arithmetic is internally consistent: 67.5 divided by 17.2 is 3.92.
The number is real and correctly reported. It does not support what it is used to support, for three reasons.
It is close to tautological. The dependent variable is systems in governed production. Having integrated governance is definitionally close to a precondition for a system being classified as governed, so this largely measures the internal consistency of self-report.
It is cross-sectional and self-reported, establishing no temporal ordering, which means it cannot distinguish governance-in-place-first from governance-retrofitted. That distinction is precisely the question being asked of it.
And it is vendor-sponsored by a company selling AI governance tooling. Independent fielding mitigates the framing incentive; it does not remove it.
The same three defects apply to the IBM Institute for Business Value study of 2,000 C-level technology executives across 33 countries. Its descriptive findings are useful: 77% report AI adoption outpacing governance capability, 70% report business teams deploying faster than IT can track, and only 11% believe they are ready for the agent deployment scale they expect. Its outcome correlations are not credible as causal estimates, and should be cited as a description of what vendors claim.
The better-evidenced version of the governance claim is a recognition-action gap, and it is a different claim.
Stanford's AI Index reports a McKinsey survey of 759 respondents across more than 30 countries showing a consistent gap between risks recognised as relevant and risks actively mitigated:
| Risk | Recognised | Mitigated |
|---|---|---|
| Cybersecurity | 66% | 55% |
| Regulatory compliance | 63% | 46% |
| Personal privacy | 60% | 50% |
| IP infringement | 57% | 38% |
| Organisational reputation | 45% | 29% |
| Explainability | 40% | 26% |
| Fairness | 34% | 26% |
Every row has a gap. The widest is on intellectual property infringement, at 19 points. The accompanying finding is the one that connects to this review: larger organisations are not more likely than others to address risks relating to accuracy or explainability, which are precisely the risks most implicated in the failure cases.
Governance is systematically declared before it is operationalised. That is a well-evidenced claim about behaviour, and it is much more useful than an unfalsifiable claim about efficacy.
10.4 The high performers cannot bear the weight
The single most-recycled evidence base in practitioner AI writing is McKinsey's high-performer group: roughly 6% of a sample of 1,993, defined as organisations attributing 5% or more of EBIT to AI and reporting significant value from AI use. They are reported as more than three times more likely to pursue enterprise-wide transformative change, nearly three times as likely to fundamentally redesign workflows, at least three times more likely to scale agents across functions, and three times more likely to strongly agree that senior leaders demonstrate ownership.
There is no longitudinal element, and that is the finding rather than a caveat. The survey has run annually since 2017, but each wave is a fresh cross-section of self-selected respondents. No cohort is followed. There is no attrition analysis. There is no way to establish whether workflow redesign preceded value or was reported retrospectively by firms that already had it.
The high-performer group is defined by the outcome variable. Every "three times more likely" is a contemporaneous correlation between two self-reported items in the same instrument, answered by the same person, on the same day. The direction of causation is unidentified, and the most parsimonious reading is that organisations getting value from AI describe their own leadership more favourably.
10.5 What has never been studied at all
One claim is asserted widely and evidenced nowhere: that AI projects succeed when a named business owner of the target process exists before the project starts.
I searched for empirical work on it specifically and found only vendor marketing. The closest defensible proxy is the McKinsey workflow-redesign finding, which is a different construct carrying the causal-direction problem above.
Workflow ownership is a plausible and widely asserted precondition with no supporting empirical study, and it is a testable gap. A clear statement that a claim is plausible and unevidenced is worth more than a dressed-up vendor blog, and it tells a researcher exactly what to go and do.
11. Practices: what to do, and why the standard list is insufficient
The standard remedy list is correct. Define the problem. Fix the data foundation. Secure executive sponsorship. Involve domain experts. Plan for deployment from the start.
It has been correct for a decade, which is fairly strong evidence that stating it again is not the intervention.
The six recommendations below are different in kind. They are about the design of the decision process rather than the conduct of the project, four of them are derived from this review's own case analysis rather than from a framework, and all six are things that can be checked from outside the project by someone who cannot evaluate the model.
11.1 Interpose a checkpoint between AI output and irreversible commitment
In six of the seven adverse cases in Section 8, the decisive moment was not the model's output. It was the conversion of that output into something the organisation could not take back.
Capital deployed on a house that could not be unbought. A grade issued to a student with no appeals mechanism capable of handling the volume. An alert fired on a ward, on 18% of all hospitalisations, with no team owning the response. A visa application streamed to heavier scrutiny with no published logic. A benefit advance referred for extra scrutiny. An invoice paid in full for services that had not been delivered.
At each of those points, a model output crossed from being information into being a commitment, and in every case the crossing was automatic. Nothing sat there.
So put something there. The checkpoint does not need to be a human reviewing every output, which does not scale and which the DWP case shows can be present and still insufficient when the reviewer is denied the model's rating. It needs to be a named person or function that owns the conversion, a stated basis on which the conversion can be refused, and a record of refusals. If the refusal rate is zero over a meaningful period, the checkpoint is decorative and you have learned something.
This is the strongest practical recommendation in this review. The frameworks examined here put their controls around the model. None of them names one at the point of commitment.
11.2 Pre-specify a failure criterion that can come out negative
Both success cases in Section 8 did this. MASAI pre-registered interval cancer rate, a metric that could have condemned the system. Kaiser pre-specified 30-day mortality after alert.
Zillow, MD Anderson and Epic-at-hospitals had no pre-specified failure criterion at all. Not a weak one. None.
The test is not whether success is defined. Everybody defines success. The test is whether a specific, measurable outcome was named in advance, before deployment, which if observed would end the project. If no such outcome exists, the project cannot fail, in the sense that no observation will be treated as evidence against it, and Section 9.5 explains what happens to projects that cannot fail: they escalate, and stopping them requires an external trigger.
There is a corollary worth stating for anyone who reads that as bureaucratic. A pre-specified failure criterion is protection for the team, not a threat to it. It converts "we are killing your project" from a judgement about competence into the operation of a rule that everyone agreed to when the project was still small.
11.3 Build the counterfactual before you need it
None of the failures could answer "compared to what?" until an outsider constructed the comparison afterwards.
Zillow's nearest comparison existed only because a competitor happened to be running the same experiment and publishing its figures. That is luck, and Section 8.2 shows that even then the comparison took two years of subsequent filings and a court order to read correctly. Epic's counterfactual arrived when an academic team asked what happened to the sepsis patients the model missed, and found that 60% of them received timely antibiotics anyway. Nobody inside the deployment had asked.
The comparison arm does not have to be a randomised trial. It has to be a defined population, decided in advance, that does not receive the model's output, and it has to be measured on the same outcome. That is the difference between the successes and the failures in this set, and it is a design decision taken before deployment rather than an analysis performed afterwards.
The question to ask before any AI deployment is: if this system produces no benefit at all, what observation would tell us? If the answer requires an outsider to build a comparison after the fact, the deployment is not evaluable.
11.4 Size the decision spread to the model's own published error distribution
The Zillow case is the cleanest available illustration of an entirely arithmetic failure.
Zillow's published median error for off-market homes was 6.9%. Zillow Offers bought off-market homes, against a target margin in the low single digits. Half of all offers were therefore wrong by more than the entire margin, at the model's advertised accuracy, before any market movement.
That calculation required no internal data. Both numbers were public, on the company's own website, and the arithmetic is one line.
The general form: when a model's output drives a decision with a financial or operational spread, the spread must be sized against the model's own error distribution, not against its central estimate. And it must be sized against the distribution, not the mean, because the mean is not what bankrupts you, which is the same point Section 4.4 makes about project cost overruns.
11.5 Treat a vendor performance claim as a hypothesis until validated locally
Epic's claimed area under the curve of 0.76 to 0.83 existed only in internal, non-peer-reviewed documentation. External validation at one site produced 0.63.
The authors of that validation named the structural problem: "The increase and growth in deployment of proprietary models has led to an underbelly of confidential, non-peer-reviewed model performance documents." They also noted that complex proprietary models "may present insurmountable barriers to local external validation" for organisations without data science capacity, which means this recommendation is easy to state and genuinely hard to follow for most buyers.
Two practical forms it can take even without that capacity. Make the vendor's performance claim contractually conditional on local reproduction, so that failure to reproduce is a commercial event rather than an academic disagreement. And require that the claim be traceable to a document the buyer can read. Section 7.6 notes that as recently as February 2026, in a peer-reviewed validation paper, the vendor's benchmark figure was cited to a video call.
11.6 Build the reference class
Reference class forecasting is the most evidence-backed remedy in the entire project literature. Forecast from the distribution of outcomes of comparable completed projects rather than from analysis of the project in front of you. Established government practice reflects it: UK optimism bias uplifts as reported by Flyvbjerg run at 15% at the 50th percentile and 32% at the 80th for roads, 40% and 57% for rail, and 23% and 55% for fixed links.
It is currently impossible for AI projects, because no reference class distribution exists. There is no publicly maintained outcome distribution for AI projects with a stated definition and a stated denominator. Section 3 is, in a sense, an inventory of the attempts to substitute a headline rate for one.
So the most evidence-backed remedy in the field cannot be applied, and building the thing that would let it be applied is simultaneously the practical remedy and the research agenda. That is the argument of Section 12.
11.7 What to say about the standard list
Do not omit it, and do not pretend it is wrong.
RAND's recommendations, the ML Test Score's 28 tests across four categories, and CRISP-ML(Q)'s quality gates are all reasonable. Several are better than reasonable. The ML Test Score in particular is concrete enough to be actionable, and its own reported result is worth knowing: across structured interviews with 36 teams at a single large technology company, "none of these tests was implemented by more than 80% of teams".
What is missing, in every case, is evidence that following any of them causes better outcomes. Not weak evidence. None. No study in this review's evidence base tests a framework against outcomes with a comparison group.
Normative guidance is not outcome evidence, and this field has substituted one for the other regardless. That is not an argument against the frameworks. It is an argument against citing them as though the question of whether they work had been settled.
One RAND recommendation deserves elevation because it is unusually concrete and needs no technical judgement to apply:
"Before they begin any AI project, leaders should be prepared to commit each product team to solving a specific problem for at least a year."
RAND states it twice. The corollary is mine rather than RAND's: a project not worth that commitment is probably not worth starting. It is a portfolio filter that requires no technical judgement, no maturity model and no consultant, and it screens out precisely the class of project that Section 9.6 predicts will dominate the selection process: the one that reads well in a board deck and is not intended to survive contact with a second budget cycle.
There is a more formal version of the same instinct worth engaging with. Vallone's short scoping review of AI pilot failure rates, which reaches this review's Section 3 conclusion from six grey-literature sources rather than from a traced taxonomy, proposes funding AI portfolios on a real-options basis: small staged commitments with explicit exercise and abandonment points. That is the same structure as RAND's year commitment and MASAI's staged publication, arrived at from finance rather than from cases, and it has the advantage of making abandonment a planned outcome rather than an admission. I have not seen it tested, and neither has its author, who presents it as a managerial implication rather than a finding. He discloses that he is chief AI officer of an AI company; on the argument of Section 3.3 that informs weighting rather than invalidating the point.
12. Research agenda
Every item here is derived from a documented absence in the preceding sections. Two require no new fieldwork and no new dataset, only an organisation willing to publish what it already holds.
Code data failures by purpose-dependence. Every study treats data as one cause. It is two, and they have opposite remedies. Suitability failures are purpose-relative, so they are formulation failures observed downstream and no amount of data engineering fixes them. Availability and integrity failures are purpose-independent and are exactly what data engineering is for. No study in this review's evidence base codes the distinction, which means the field's most-cited rivalry, Kalinowski's Input at 37.41% against Data at 33.09%, may not be a rivalry at all. Both figures are shares of coded causes, one answer per respondent, and the paper says explicitly that they are not probabilities. Section 6.2 shows that Kalinowski's own leaf codes cannot settle it, because the two largest, Data Quality and Data Collection, could fall either way. The nearest thing to a coding already exists and is unremarked: Sambasivan's cascade triggers sort along exactly this line, with inadequate domain expertise at 43.4% and conflicting reward systems at 32.1% on one side and physical-world brittleness at 54.7% on the other. Her fourth trigger, poor cross-organisational documentation at 20.8%, does not obviously sit on either side, which is itself worth knowing before anyone runs the coding. Those are prevalences within 53 purposively sampled practitioners rather than population rates, which is a reason to run the coding properly rather than a reason to dismiss the pattern. It decides how the two largest cause categories relate, and it is the precondition for any claim that formulation work addresses the dominant failure mode.
Build the reference class. A publicly maintained outcome distribution for AI projects, with a stated definition and a stated denominator. It is the precondition for every other question in this review, including the one on its cover, and without it the remedy in Section 11 cannot be applied at all.
Report the shape, not the rate. Apply the Flyvbjerg method to AI: one consistent outcome measure, a stated null hypothesis, and results on mean, tail index, frequency of extreme outcomes and tail magnitude. Section 4.4 sets out why. No published AI study reports a distributional shape at all, so the entire genre is reporting the one statistic that cannot detect the difference it claims to have found.
Run the definitional experiment. Take a real portfolio, hold its performance constant, vary the success definition across the taxonomy in Section 3, and report how far the failure rate moves. Eveleens and Verhoef did exactly this to the Standish definition in 2010 and moved one organisation's success rate from 5.8% to 94.2% on identical underlying performance. The equivalent has never been run on AI. It requires no new fieldwork, only one organisation willing to publish, and it would settle an argument the field has been having for four years.
Assemble a success comparison group. The single largest design gap. There is no matched-sample or control-group study comparing organisations that succeeded with AI against organisations that failed, holding pre-project conditions constant. Any study of AI failure with a matched success sample would be the strongest design this field has produced. The five conditions in Section 8.7 are specific enough to serve as its hypotheses. The design should sample outside healthcare, because both success cases available to this review are clinical and the five conditions are also a description of standard clinical research practice. A matched sample drawn from commercial or public-sector deployments is the only way to tell a property of successful AI projects from a property of medicine.
Follow a cohort prospectively. Nobody has followed AI projects from initiation to outcome with recorded decision points. Every existing study is retrospective and cross-sectional, which means every timing claim in this literature, including the ones in Section 7, is reconstructed rather than observed. A prospective cohort is the only design that can test whether the fatal decisions really are concentrated at initiation, or whether that is an artefact of what people remember when asked afterwards.
Get quasi-experimental evidence at project or programme level. The strongest causal work in this entire area measures individual worker task outcomes: customer support agents, consultants performing defined tasks. That work is excellent and it is answering a different question. There is nothing comparable at the level of an enterprise AI project or programme, and the gap between those two levels of analysis is a real part of where the disagreement in this field lives.
Test the portfolio reconciliation. Firm-level associations between AI use and productivity are positive in peer-reviewed work. Project-level failure rates are reported as high. Both can be true if firms run portfolios and abandon cheaply, which is a specific and testable interpretation. No paper tests it. It would also, if true, reframe part of what the failure literature reports as loss into the expected cost of a functioning option strategy, which is close to the real-options reading Vallone proposes.
Apply the mum and deaf effects to AI projects. A mature information systems research programme establishes that roughly 30 to 40% of IS projects escalate, that status reports are biased 60% of the time and are about twice as likely to be optimistically as pessimistically biased, and that de-escalation is almost always triggered from outside the project. Section 9.5 argues that AI supplies more of every input that mechanism needs, and that escalation rates in AI projects should therefore exceed the baseline. That is a specific numerical prediction, drawn from an established instrument, and nobody has measured it.
Test institutional pressures against efficiency directly. There is causal evidence that institutional cues raise stated intention to adopt AI, from a vignette experiment on 497 Belgian municipal managers. There is no large-N test of whether organisations adopt AI for legitimacy rather than for efficiency, which is the claim the second-order literature needs and does not have. The design is not exotic: the missing element is a measured efficiency expectation to set against a measured legitimacy pressure, on the same firms, with adoption behaviour rather than intention as the outcome.
Two of these ten, the definitional experiment and the purpose-dependence coding, need no new data collection at all: the first re-scores an existing portfolio, the second re-codes existing answers. That nobody has done either, in four years of intense attention to this question, is the most economical summary of the field's condition that I can offer.
13. Conclusion
Six things, in the order they were established.
The headline numbers do not measure one thing. They measure organisations, portfolios, projects, use cases, models and opinions, over windows ranging from six months to four years, against success criteria that include estimate conformance, subjective executive remarks, and net clinical harm. Seven of the nineteen most-cited figures are not measurements of anything that happened. Their clustering between 70 and 95 per cent is produced by that heterogeneity. What survives classification is six scoped, conditional numbers answering six different questions, none of which is the question everybody asks.
The causal evidence is convergent, thinner than its citation implies, and almost entirely about the wrong technology. Six methodologically independent samples agree that failure concentrates in problem formulation and data foundation, and every one of them reads those causes as organisational rather than technical. That is a real finding, and it is attribution rather than causation: none of these designs tests a mechanism. It also rests on studies of 18, 45 and 53 people, one dataset of six interviews reported twice as though it were two studies, a Delphi panel that did not reach consensus, and an anchor study with a 13.2% response rate whose own authors warn that its results "may be skewed toward identifying leadership failures". And nearly all of the fieldwork predates the generative AI deployment wave. The evidence base built to explain why predictive machine learning projects failed is being asked to explain something else.
The fatal decisions precede the model, and they were detectable. In all seven adverse cases, six terminated failures and one contested continuing deployment, the fatal omission was made before the model existed: at contracting, at problem framing, at label selection, at feature selection, at deployment governance, at objective specification, at data collection. In six of the seven, a competent modeller building exactly what was specified would have produced exactly what was produced. Across those six, the number of things genuinely unknowable at the time is two. The seventh, Epic, is a separate category and the boundary case for the generalisation: its leaked predictor is a modelling error on its face, and Sections 7.4 and 8.4 argue it is better read as a product-architecture decision taken by a vendor, structurally undetectable by the hospitals carrying the risk.
Detection was never the constraint. In four of the six cases where use stopped, stopping required external legal or commercial force rather than internal evidence. Epic's model ran for two and a half years after its negative validation was published, in safety-net hospitals. Ofqual received the specific failure modes in writing from the national statistical society four months in advance, and its response was to offer the experts a non-disclosure agreement.
On mechanisms and second-order causes, this is the same failure with better marketing. The pre-AI literature already explains everything the AI literature reports as new. Escalation of commitment, the mum and deaf effects, strategic misrepresentation, benefits realisation shortfall, and survival of the unfittest were all established before any of this. And AI supplies more of every input those mechanisms need: higher information asymmetry, vaguer success criteria, research framing as the default, external justification pressure that is now measurable in earnings-call data, and weakened external evaluability.
On rate and distribution, nobody knows. The comparison with conventional IT has never been made, and one side of it is an artefact of definition to a degree that swamps any real variation: hold one organisation's forecasting performance completely constant, invert only the direction of its estimating bias, and its measured success rate moves from 5.8% to 94.2%. Meanwhile the one dimension on which a genuine difference could be established, the shape of the outcome distribution, is the one dimension nobody has looked at. What makes IT distinctive among 23 project types is its tail, not its mean. No AI study reports a tail, a median, or any distributional statistic whatsoever.
The highest-leverage intervention is not a better model. It is a deliberate checkpoint between AI output and irreversible organisational commitment, because that conversion is where six of the seven adverse cases actually turned, and because none of the standard frameworks this review examined puts a control there.
The observation to end on
The most rigorous quantification of AI deployment failure anywhere is not in the enterprise literature. It is a systematic review of 91 sepsis prediction model studies, which finds a median external-validation Utility Score of −0.164. A negative Utility Score means net harm relative to using no model at all. The median model in that class, under full-window external validation, makes patients worse off.
That finding exists because medicine has an external validation culture and a shared outcome metric. Somebody went and checked, had a defined thing to check against, and published the answer when it was unwelcome.
There is no equivalent finding in enterprise AI.
That absence is not evidence that enterprise AI works better. It is evidence that nobody measures.
Which brings the argument back to where it started. This review opened with a chain of citation running from an unnamed set of opinion surveys, through a magazine profile of a vendor, into the claim this field repeats most, unchallenged for four years. That chain did not survive because it was hard to check. It survived because checking it required somebody to open the footnote, and the footnote is one line long.
The work this field most needs is not more sophisticated. It is more ordinary. Read the primary source. Carry the author's own limitations with the number. Say which quantity you are reporting and over what window. State the denominator. Name what would have to be observed for you to be wrong, before you deploy rather than after.
None of that is a methodology. It is just the job.
References
Citation style is author-date in the text, with full details here. Where a source is a press release, a filing, a survey report or a working paper rather than a peer-reviewed publication, that is stated in the entry, because the distinction is load-bearing throughout this review.
A note on this list. Article titles appear only where I hold the title from a source I read. Where an entry gives author, year, journal, volume and pages without a title, that is because the title was not in the record I verified, and I would rather leave a gap than supply a plausible one. The same applies to volumes, issues and page numbers: several entries below are deliberately incomplete, and the incompleteness is marked.
Peer-reviewed publications
Acemoglu, D. (2025) Economic Policy, 40(121), pp. 13-58. Analytical and calibrated with parameters drawn from other studies; not an empirical estimation, and frequently miscited as a measurement.
Amershi, S., Begel, A., Bird, C., DeLine, R., Gall, H., Kamar, E., Nagappan, N., Nushi, B. and Zimmermann, T. (2019) ICSE-SEIP. 14 interviews plus 551 survey respondents from 4,195 invitations, all at Microsoft.
Bérubé, M., Giannelia, T. and Vial, G. (2021) HICSS-54, pp. 6704-6713. Fieldwork October to December 2019; 41 invited, 26 agreed, 18 completed all phases. Kendall's W of 0.262 after round one and 0.432 after round two, which the authors describe as "a slight improvement, but still somewhat low".
Breck, E. et al. (2017) 'The ML Test Score', IEEE Big Data. Structured interviews with 36 teams at a single company.
Brynjolfsson, E., Li, D. and Raymond, L. (2025) Quarterly Journal of Economics, 140(2), pp. 889-942. Staggered difference-in-differences, 5,179 customer support agents, 3 million chat observations.
Brynjolfsson, E., Rock, D. and Syverson, C. (2021) 'The Productivity J-Curve: How Intangibles Complement General Purpose Technologies', American Economic Journal: Macroeconomics, 13(1), pp. 333-372. NBER Working Paper 25148.
Czarnitzki, D., Fernández, G.P. and Rammer, C. (2023) Journal of Economic Behavior & Organization, 211, pp. 188-205. German firm survey, OLS and instrumental variables. Sample size not obtained.
Dell'Acqua, F. et al. (2026) Organization Science, 37(2). DOI 10.1287/orsc.2025.21838. Pre-registered randomised controlled trial, 758 consultants. Cite this version, not the widely circulated 2023 working paper.
Escobar, G.J., Liu, V.X., Schuler, A., Lawson, B., Greene, J.D. and Kipnis, P. (2020) 'Automated Identification of Adults at Risk for In-Hospital Clinical Deterioration', New England Journal of Medicine, 383(20), pp. 1951-1960.
Ermakova, T. et al. (2021) 'Beyond the hype: why do data-driven projects fail?', HICSS-54. 13 interviews plus 112 experts across 11 industries.
Eveleens, J.L. and Verhoef, C. (2010) 'The Rise and Fall of the Chaos Report Figures', IEEE Software, 27(1), pp. 30-36.
Ewusi-Mensah, K. and Przasnyski, Z.H. (1995) Journal of Information Technology, 10(1), pp. 3-14. Sample size not obtainable.
Flyvbjerg, B. (2006) Project Management Journal, 37(3). On reference class forecasting.
Flyvbjerg, B. (2014) Project Management Journal. Source of "survival of the unfittest" and of the front-end planning argument. Issue and page numbers not verified.
Flyvbjerg, B. (2021) 'Top Ten Behavioral Biases in Project Management', Project Management Journal, 52(6).
Flyvbjerg, B. and Budzier, A. (2011) Harvard Business Review, September. 1,471 IT projects; 92% public agencies, 83% US-based.
Flyvbjerg, B., Budzier, A., Aaen, J., Keil, M. and Zottoli, T. (2026) 'The Uniqueness of IT Cost Risk: A Cross-Group Comparison of 23 Project Types', Project Management Journal, 57(1), pp. 14-43. DOI 10.1177/87569728251340590. 11,011 projects across 126 countries. The full 23-row table, the count of IT projects within the 11,011, and the authors' explanation for IT's uniqueness sit behind a paywall and were not read.
Flyvbjerg, B., Budzier, A., Lee, J.S., Keil, M., Lunn, D. and Bester, D. (2022) Journal of Management Information Systems. DOI 10.1080/07421222.2022.2096544. 5,392 IT projects completed 2002-2014, USD 56.5 billion, 66 countries. One internal inconsistency in the tail statistics is unresolved and no tail percentage from this paper is cited in this review.
Flyvbjerg, B., Holm, M.S. and Buhl, S. (2002) 'Underestimating Costs in Public Works Projects: Error or Lie?', Journal of the American Planning Association, 68(3), pp. 279-295.
Granados, C., Ayala, Y. and Ramos-Mejia, M. (2024) 'Is it substantive or just symbolic? Understanding innovation theater in organisations', Technovation, 129, 102880. Inductive and qualitative, not a large-N test.
Johnson, N. et al. (2024) 'The fall of an algorithm: characterizing the dynamics toward abandonment', FAccT '24. DOI 10.1145/3630106.3658910. 40 cases; 24 abandoned, 16 still in use at publication.
Jöhnk, J., Weissert, M. and Wyrtki, K. (2021) Business & Information Systems Engineering, 63(1), pp. 5-20. 25 AI experts, 1,385 minutes of interviews. A readiness framework, not a failure study.
Jørgensen, M. and Moløkken-Østvold, K. (2006) Information and Software Technology. DOI 10.1016/j.infsof.2005.07.002. Volume, issue and page numbers commonly given as 48(4), 297-301, but not confirmed, so they are not stated here.
Kalinowski, M., Mendez, D., Giray, G., Santos Alves, A.P., Azevedo, K., Escovedo, T., Villamizar, H., Lopes, H., Baldassarre, T., Wagner, S., Biffl, S., Musil, J., Felderer, M., Lavesson, N. and Gorschek, T. (2025) 'Naming the pain in machine learning-enabled systems engineering', Information and Software Technology, 187, article 107866. DOI 10.1016/j.infsof.2025.107866. Cite this version rather than the preprint (arXiv:2406.04359), but note that the 39-page arXiv version contains Figure 12(b) with the leaf-level codes and the 20-page author-hosted PDF stops at Figure 7 and does not.
Kappelman, L.A., McKeeman, R. and Zhang, L. (2006) Information Systems Management, 23(4), pp. 31-36. The panel size and composition for the ratings stage are not stated in the version read.
Keil, M. (1995) 'Pulling the Plug', MIS Quarterly, 19(4), pp. 421-447. 197 interviews with 111 individuals, 19 meetings observed, more than 350 historical documents.
Keil, M., Mann, J. and Rai, A. (2000) MIS Quarterly, 24(4), pp. 631-664. Deliberately designed to gather data on non-escalated projects as a comparison baseline.
Keil, M. and Robey, D. (1999) Journal of Management Information Systems, 15(4), pp. 63-87. 42 interviews with IS auditors, 39 usable cases.
Klakegg, O.J., Williams, T., Walker, D., Andersen, B. and Magnussen, O.M. (2011/2012) Project Management Journal, 43(2). Literature review, nine governance frameworks across Australia, Norway and the UK, 14 expert interviews, eight in-depth case studies.
Lång, K. et al. (2023) The Lancet Oncology, 1 August. MASAI interim safety analysis, 80,033 women aged 40 to 80.
Lång, K. et al. (2026) The Lancet. DOI 10.1016/S0140-6736(25)02464-X, announced 29 January 2026. MASAI primary outcome. All figures cited in this review come from journal-issued press materials carrying journal-supplied numbers rather than from the papers themselves, and confidence intervals were not in those materials.
Li, C., Lin, Y., Tu, X., Chen, J. and Zhao, Z. (2025) 'Synthesizing AI Failure Research: A Scoping Review', Business & Information Systems Engineering. DOI 10.1007/s12599-025-00970-2. Received 17 December 2024, accepted 12 September 2025, published 27 October 2025. The article body is paywalled; the reference list and the methodological appendix are public and are what this review's positioning rests on.
Lyytinen, K. and Hirschheim, R. (1987) Oxford Surveys in Information Technology, 4, pp. 257-309. Read only through a 1999 secondary source quoting the original. The original was not retrieved, and the four failure types are this review's classification spine, so that gap is stated in Section 3.
McElheran, K. et al. (2024) Journal of Economics & Management Strategy, 33(2). DOI 10.1111/jems.12576. 2018 Annual Business Survey: 850,000 firms surveyed, 474,000 analysed. The authors state a survival-bias limitation: firms that adopted AI and then failed are excluded.
Nahar, N., Zhou, S., Lewis, G. and Kästner, C. (2022) ICSE '22. Straussian grounded theory, 45 participants across 28 organisations, member-checked with 10 interviewees.
Nahar, N. et al. (2023) CAIN. Meta-summary aggregating 50 papers covering more than 4,758 practitioners.
Ostermayer, D. et al. (2024) JAMIA Open, 7(4), ooae133. 145,885 encounters across two Harris County, Texas safety-net hospitals during calendar year 2023.
Paleyes, A., Urma, R.-G. and Lawrence, N.D. (2022) ACM Computing Surveys, 55. DOI 10.1145/3533378. Secondary synthesis, not primary data. Issue and article number unresolved: the arXiv record gives volume 55, number 11, article 243; another source gives 55(6). The DOI is not in doubt.
Peppard, J., Ward, J. and Daniel, E. (2007) MIS Quarterly Executive, 6(1), pp. 1-11. On benefits realisation.
Rodriguez Müller, A.P., Tangi, L. and Lerusse, A. (2025) 'Understanding the Adoption of Artificial Intelligence in Local Government Decision-Making: The Influence of Institutional Pressures and Managerial Perceptions', Public Administration. DOI 10.1111/padm.70033. First published online 19 November 2025. Early View: no volume, issue or page numbers exist. Randomised between-subjects vignette experiment; 8,401 invited, 835 valid responses, 338 excluded on an attention check, n=497 analysed. Open access, CC BY 4.0. Preregistration and replication data are public.
Sambasivan, N., Kapania, S., Highfill, H., Akrong, D., Paritosh, P. and Aroyo, L. (2021) '"Everyone wants to do the model work, not the data work": Data cascades in high-stakes AI', CHI '21. DOI 10.1145/3411764.3445518. 53 practitioners across India, the United States, and East and West Africa.
Schlegel, D., Schuler, P. and Westenberger, J. (2023) IJISPM, 11(3), pp. 25-40; and Westenberger, J. et al. (2022) Procedia Computer Science, 196, pp. 69-76. One dataset of six semi-structured expert interviews conducted January to February 2021, reported in two venues. No frequency counts are reported for any of the twelve failure factors, so any downstream ranking of them has been invented.
Sculley, D. et al. (2015) NeurIPS. Contains no number, no measurement and no percentage of any kind for the proportion of an ML system that is ML code. Every such figure in circulation was invented downstream.
Shankar, S. et al. (2024) '"We have no idea how models will behave in production until production"', PACM HCI, 8(CSCW1), article 206. DOI 10.1145/3653697. 18 ML engineers, saturation around interview 16. Cite this, not the 2022 arXiv preprint 2209.09125; they are the same study.
Smith, H.J. and Keil, M. (2003) Information Systems Journal, 13(1), pp. 69-95. On the mum effect. Theory development, not empirical.
Studer, S. et al. (2021) CRISP-ML(Q), Machine Learning and Knowledge Extraction, 3(2), pp. 392-413. Cite the journal version rather than arXiv:2003.05155. Conceptual process model, no sample, no measurement, and not evidence of anything about failure rates.
Sturdy, A., Kirkpatrick, I., Reguera Alvarado, N., Blanco-Oliver, A. and Veronesi, G. (2022) 'The management consultancy effect: Demand inflation and its consequences in the sourcing of external knowledge', Public Administration. Four years of English NHS data.
Varajão, J. and Trigo, A. (2024) 'Assessing IT Project Success: Perception vs. Reality', ACM Queue, 22(4). 193 completed questionnaires from IT project managers across 500 companies. Self-reported.
Wang, Y. et al. (2025) npj Digital Medicine, 8, article 190. DOI 10.1038/s41746-025-01587-1. Systematic review of 91 sepsis prediction model studies, 2017-2023.
Weber, M. et al. (2023) Information Systems Frontiers, 25(4), pp. 1549-1569. 25 semi-structured interviews conducted 2018 to 2020, averaging 29 minutes.
Wong, A., Otles, E., Donnelly, J.P. et al. (2021) 'External Validation of a Widely Implemented Proprietary Sepsis Prediction Model in Hospitalized Patients', JAMA Internal Medicine, 181(8), pp. 1065-1070. DOI 10.1001/jamainternmed.2021.2626. No author declares any relationship with Epic Systems; declared funding is NIH and NHLBI.
Wong, A., Currey, D., Schwinne, M. et al. (2026) JAMA Network Open, 9(2), e260181, published 27 February 2026. Prospective, multicentre, four US health systems, August 2023 to March 2025, 227,091 inpatient encounters. No author is affiliated with Epic Systems and no Epic funding is declared. The paper left-censors certain prediction scores "per developer recommendation", and cites Epic's internal validation figures to a private meeting with two Epic employees rather than to a published source.
Reports, filings, releases and working papers
Blades, R., Bilinski, P. and Kraft, A. (2026) 'Analysts' Response to "AI Washing" in Earnings Conference Calls', SSRN, 26 February. Bayes Business School. Working paper.
Bonney, K. et al. (2024) NBER Working Paper 32319, using US Census Bureau Business Trends and Outlook Survey data. Approximately 164,500 businesses, average response rate 16%. Not peer reviewed.
Boston Consulting Group (2024) press release, 24 October. 1,000 CxOs across 59 countries. The 10-20-70 split describes how leaders allocate resources; it is not a diagnosis of why projects fail.
Boston Consulting Group (2025) release, 30 September. 1,250 senior executives. The reported performance multiples are cross-sectional correlations, not causal estimates.
Committee of Public Accounts (2025) Use of AI in Government, Eighteenth Report of Session 2024-25, 26 March.
Deloitte (2024) State of Generative AI in the Enterprise, 20 August. n=2,770 across 14 countries, fielded May to June 2024. The sampling frame is pre-filtered to organisations already piloting or implementing generative AI.
Deloitte (2024) State of Generative AI in the Enterprise, Q4. The portfolio-versus-best-project pairing cited in Section 3.3 comes from a secondary account and was not independently re-fetched.
Deloitte (2025) survey published 22 October. n=1,854 across 14 European and Middle Eastern countries, fielded 15 August to 5 September 2025. EMEA, and routinely cited as global.
Department for Work and Pensions (2025) Universal Credit Advances Model: Fairness Assessment, 17 July, covering 1 April 2024 to 31 March 2025. The February 2024 internal analysis was obtained by the Public Law Project under freedom of information and reported in December 2024.
Dimensional Research / Alegion (2019) survey, May. n=227. Vendor-sponsored by a data-labelling company whose product the headline finding sells, and the finding is that projects "stall", not that they fail.
Domino Data Lab / BARC (2026) Enterprise AI Report. 639 senior enterprise AI leaders at director level and above; North America 397, UK 148, Continental Europe 94; fieldwork April 2026. Vendor-sponsored, cross-sectional, self-reported.
Gartner press releases: 13 February 2018; 29 July 2024; 26 February 2025; 25 June 2025; 7 April 2026. The first four are predictions. The June 2025 release's only disclosed quantitative input is a January 2025 webinar poll of 3,412 self-selected attendees. No retrospective on any of the four predictions was found.
Government Legal Department (2020) letter to Foxglove, 3 August, undertaking to stop using the Home Office visa streaming tool pending redesign; use suspended from 7 August 2020. Judicial review proceedings were filed in June 2020 by the Joint Council for the Welfare of Immigrants, represented by Foxglove.
IBM Institute for Business Value / Oxford Economics (2026) CIO study, June. 2,000 C-level technology executives across 33 countries; fielded January to April 2026. Its outcome correlations are not credible as causal estimates and are cited in this review only as a description of what vendors claim.
IDC, reported via CIO (2025), 25 March. The 33-to-4 proof-of-concept ratio could not be found in any primary IDC or Lenovo document. The verified regional variants are 23-to-3 for Asia/Pacific (n=900) and 41-to-5 for Europe and the Middle East (n=620).
Li, B. (2025) 'AI Washing', working paper, University of Florida, August. 20,135 firm-quarter observations, 721 unique US public firms, 2016Q1 to 2024Q2, using Revelio Labs résumé data covering more than 75 million job records. Not peer reviewed.
McElheran, K., Yang, M.-J., Kroff, Z. and Brynjolfsson, E. (2025) 'The Rise of Industrial AI in America: Microfoundations of the Productivity J-curve(s)', US Census Bureau Center for Economic Studies Working Paper CES-25-27, April. Approximately 28,500 establishments and 55,000 firms.
McKinsey & Company (2025) survey published 5 November. n=1,993 across 105 nations, fielded 25 June to 29 July 2025, GDP-weighted. Repeated cross-sections since 2017; no cohort is followed and no attrition analysis exists.
McKinsey and the BT Centre for Major Programme Management, University of Oxford (2012). More than 5,400 IT projects with initial budgets over $15 million. Shares Oxford provenance with the Flyvbjerg IT database, so it is not independent corroboration.
MIT NANDA (2025) The GenAI Divide: State of AI in Business 2025, v0.1, July. Authors Challapally, Pease, Raskar and Chari. 52 organisations interviewed, 153 senior leaders surveyed, more than 300 initiatives reviewed, research period January to June 2025. Self-describes as preliminary findings, lists a single internal reviewer, names no peer review process, and is absent from MIT Media Lab NANDA publication pages. An archived copy is held by this review. The 150-interview and 350-employee figures in wide circulation originate in press coverage of August 2025, not in the report.
National Audit Office (2024) Use of artificial intelligence in government, HC 612, Session 2023-24, 15 March. Survey of 87 government bodies as at autumn 2023.
Office for Statistics Regulation (2021) Ensuring Statistical Models Command Public Confidence, 2 March.
Ofqual (2020) interim report on summer 2020 grading, and the published A-level infographic covering 718,000 entries in England, all ages. Board minutes of 16 August 2020.
Royal Statistical Society (2020) letter to the Office for Statistics Regulation, 18 August, signed by its President and Vice-President; RSS public statement, 6 August; and the Ofqual chair's reply of 21 August.
S&P Global / 451 Research (2025) Market Insight report, 13 January, from Voice of the Enterprise: AI & Machine Learning, Use Cases 2025. n=1,006 midlevel and senior IT and line-of-business professionals across North America and Europe. The survey instrument is paywalled: exact question wording, the operational definition of "abandoned", field dates, margin of error and company-size breakdown could not be obtained.
S&P Global / 451 Research (2025) Market Insight report, 18 July, from Voice of the Enterprise: AI & Machine Learning, Infrastructure 2025. n=704 mid- and senior-level IT decision-makers from the US, UK and India.
Securities and Exchange Commission (2024) Press Release 2024-36, 18 March; and Press Release 2024-70, 11 June.
Stanford HAI (2025) AI Index Report 2025, Chapter 3, reporting a McKinsey 2024 survey of 759 respondents across more than 30 countries, and an Accenture/Stanford survey of 1,500 organisations with revenues over $500 million across 20 countries.
Standish Group (1994) CHAOS Report, and subsequent editions as tabulated by Eveleens and Verhoef (2010). 365 respondents representing 8,380 applications, plus four focus groups totalling 41 IT executives. The definitions are not stable across the series.
University of Texas System Administration (2016) Special Review of Procurement Procedures Related to UTMDACC Oncology Expert Advisor Project, November. 48 pages. Dated November 2016 with no day given anywhere in the document, and public from February 2017. It is no longer served by utsystem.edu, whose page for it renders "Content unavailable". Retrieved for this review from an archive snapshot of 21 February 2017; an archived copy is held by this review. Not to be confused with MD Anderson Department of Internal Audit report 16-105, Procurement Review, 26 August 2016, which is a general supply chain audit and contains no mention of the Oncology Expert Advisor.
Vallone, J. (2025) 'Reassessing AI Pilot Failure Rates: A Scoping Review and Managerial Implications', SSRN abstract 5459054, DOI 10.2139/ssrn.5459054, written 27 August 2025, posted 29 September 2025. Seven pages, six grey-literature sources. The author declares that he serves as chief AI officer of an AI company and states that the role did not influence the analysis, which is based on public sources.
Yu, S. et al. (2026) arXiv:2607.08920, preprint. 510 unique S&P 500 firms, 2016-2025, 4,561 firm-year observations from SEC 10-K filings. The authors state that the results cannot be interpreted as causal.
Zeng, S., Wang, X. and Sun, T. 'Artificial Intelligence, Domain AI Readiness, and Firm Productivity', arXiv:2508.09634, working paper. Unbalanced panel of 20,415 firm-year observations of Chinese listed firms, 2016-2022. Not peer reviewed.
Zillow Group (2021) Q3 2021 earnings release and shareholder letter, 2 November, filed with the SEC as exhibit 99.1 to a Form 8-K; press release 'Zillow Starts Making Cash Offers For the Zestimate', 25 February 2021; and the statement of 18 October 2021 suspending new contracts. Opendoor Technologies (2021) Q3 2021 and full-year 2021 disclosures.
Journalism and trade press, cited as such
Bojinov, I. (2023) 'Keep Your AI Projects on Track', Harvard Business Review, November-December. Paywalled. The sentence carrying both the 80% and the "twice the rate" comparison gives no source for either number.
The Cancer Letter (2017), 17 February.
Dastin, J. (2018) Reuters, 10 October. The Reuters page could not be fetched; the text was verified against two independent reproductions of the same wire copy and against a third outlet.
DelPrete, M. (2021) analysis of over 20,000 iBuyer transactions from January 2020 to May 2021, published in an industry trade outlet, August.
Herper, M. (2017) Forbes, 19 February, reporting from the UT System audit.
Kahn, J. (2022) 'Want Your Company's A.I. Project to Succeed? Don't Hand It to the Data Scientists, Says This CEO', Fortune, 26 July.
Ross, C. and Swetlitz, I. (2018) STAT, 25 July; and Ross, C. (2022) STAT, 3 October, reporting from Epic corporate documents.
Schmidt, C. (2017) Journal of the National Cancer Institute, 109(5), djx113.
VentureBeat (2019). The 87% claim traces to a conference-panel remark restating an unsourced 13% from a 2017 opinion column. The VentureBeat page itself returned an error on attempted retrieval, so the origin trace is second-hand.
The anchor study
Ryseff, J., De Bruhl, B.F. and Newberry, S.J. (2024) The Root Causes of Failure for Artificial Intelligence Projects and How They Can Succeed: Avoiding the Anti-Patterns of AI, RAND Corporation, RR-A2680-1, published 13 August 2024. DOI 10.7249/RRA2680-1. 20 pages. 65 semi-structured interviews: 50 industry, 15 academia. Interviews conducted August to December 2023; research completed April 2024. Industry recruitment by LinkedIn: 379 contacted, 50 participated, 14 declined, a 13.2% response rate. Failure is defined perceptually, as "a project that was perceived to be a failure by the organization". Projects using pretrained large language models without training or customisation were out of scope. Leadership, data, and the top-down/bottom-up split were prompted categories in the interview instrument. The authors state that results "may be skewed toward identifying leadership failures".
Appendix: retrievals outstanding at the time of writing
Section 2 promised this list, and it is here rather than in a footnote because a review that audits other people's sourcing should be legible about its own.
Nothing below invalidates an argument in the body. Each item is either a detail that would sharpen a claim already made on other evidence, or a bibliographic completion. Where an outstanding item bears on a load-bearing claim, the section making that claim says so at the point of use.
All seven items ranked as first-priority before drafting have been closed. Three were closed in the course of writing this review: the audit of MD Anderson's Oncology Expert Advisor project, recovered from an archive after being withdrawn by its issuing body; the full text of the 2021 sepsis model validation, which settled the alert-burden denominators and the conflict-of-interest position for both it and its 2026 successor; and the Public Administration experiment on institutional pressures, which turned out to narrow rather than to close the gap it was sought for.
Would change how a claim reads
Opendoor's pricing governance. CLOSED, and it changed the finding. This was ranked the most valuable outstanding retrieval in the review. It was run, across SEC filings, earnings calls, independent analysis and court records, and it did not confirm the comparison it was meant to complete. It corrected it. The arithmetic in the original comparison was wrong, Opendoor lost more than Zillow twelve months later, and what survives is a different and better-evidenced claim about strategic override rather than pricing governance. Section 8.2 sets out the correction in full, because the error was the review's own and is worth more visible than hidden.
Still open from that retrieval: the percentage in paragraph 34 of the Federal Trade Commission's complaint against Opendoor, which is redacted in the public version. A figure circulates for it; it is not in the document and does not appear in this review. And the comparative homes-purchased figures for the third quarter of 2021 sit in the companies' quarterly shareholder letters rather than their filings, and could not be re-confirmed on the second attempt, so the volume contrast is the weakest element of that case.
The identity of the external consulting firm engaged to review the Oncology Expert Advisor's scientific basis, and whether that review was ever completed or released. The audit records that the assessment was assigned. It names nobody and reports no output, and I found no trace of one. If that review exists, it is the only independent evaluation of a system that cost $62.1 million, and its absence from the public record is a finding in its own right.
The full 23-row cost-risk table from Flyvbjerg et al. (2026), together with the count of IT projects inside the 11,011 and the authors' own explanation for IT's distinctiveness. All three are behind a paywall. Section 4.3 uses only the figures obtained.
The Independent Chief Inspector of Borders and Immigration's inspection report on the Home Office visa streaming tool, with its exact date and title, and the Home Office's formal response. This is the load-bearing "official warning" document for that case and it is currently cited from reporting of it.
Bojinov (2023) in full. Needed to establish what, if anything, supports the "twice the rate of IT projects" comparison. The relevant sentence is verified from secondary quotation and gives no source for either of its numbers, which is the point Section 1 makes, but reading the article would settle whether anything elsewhere in it supports the claim.
The MASAI papers in full text. All MASAI figures in Section 8.6 come from journal-issued press materials rather than from the papers themselves, and confidence intervals were not in those materials.
Ofqual's equalities analysis by socio-economic group. The 39.1% downgrade figure is verified from Ofqual's own published material. The widely made claim that disadvantaged students were disproportionately downgraded is not verified from an Ofqual source and therefore does not appear in Section 8.5.
Deloitte's Q4 2024 survey, both halves of the portfolio-versus-best-project pairing. Section 3.3 uses it as an illustration of a mechanism and flags that it comes from a secondary account.
The VentureBeat article itself, which returned an error on retrieval, to confirm the origin trace of the 87% figure first-hand rather than through the chain.
Kappelman, McKeeman and Zhang (2006) in the original, for the panel size and composition behind the dominant dozen.
Lyytinen and Hirschheim (1987) in the original. The four failure types are this review's classification spine and were read through a 1999 secondary source quoting them. Section 3 states this.
The uncertainty band on Flyvbjerg's Pareto alpha for IT. Section 4.4 reports the point estimate of 0.92 and describes IT as uniquely at or below 1, which is how the primary paper itself states the finding. An external reviewer of this draft asserted a 95% interval of 0.75 to 1.17, which would cross 1 and would soften "uniquely at or below". That figure came from secondary reporting the reviewer did not name, the primary paper returns HTTP 403 to every route tried, and no interval appears in this review's evidence base, so it is not in the paper. If the full text is obtained and the interval does cross 1, the phrasing in Section 4.4 needs a band attached to it. The point estimate and the ranking against the other 22 project types would be unaffected.
Bibliographic completions
Resolve the internal inconsistency in the tail statistics of Flyvbjerg et al. (2022), where the stated share of observations in the tail does not reconcile with the stated count against the stated sample. No tail percentage from that paper is cited in this review until it does.
Volume, issue and page numbers for Jørgensen and Moløkken-Østvold (2006). The DOI for Eveleens and Verhoef (2010), whose volume, issue and pages are established. Issue and article number for Paleyes et al. (2022). The sample size for Czarnitzki, Fernández and Rammer (2023). The exact publication day in February 2017 for the UT System audit.
The Opendoor and Upstart securities litigation dockets, held from legal commentary rather than from the filings, which is why the private-litigation strand does not appear in the body at all.
Would be nice, and changes nothing
Ewusi-Mensah (1997) in Communications of the ACM; Sauer (1993), whose triangle-of-dependences model is widely attributed and was not read; and Abrahamson (1996) on management fashion, located but not read, which Section 9.7 flags at the point of use.
The Policy and Society paper on management consultancy and instrument constituencies, whose title describes the mechanism Section 9.7 assembles by inference. Brattström (2024) on innovation theatre in corporate venturing units. The two Finance Research Letters AI-washing papers of 2026.
And one negative that would be worth confirming: whether any analyst firm has ever published a retrospective on any of its AI predictions. I found none. Absence of evidence, in that case, is exactly what it looks like.