AI project failure rates: four questions that tell you whether the number means anything
Jamie Watters
Operational resilience and AI delivery practitioner.
Someone will put an AI failure statistic in front of you this week. It will be 95%, or 87%, or 80%. It will be presented as though everyone has been measuring the same thing and the numbers have converged.
They haven't, and they aren't.
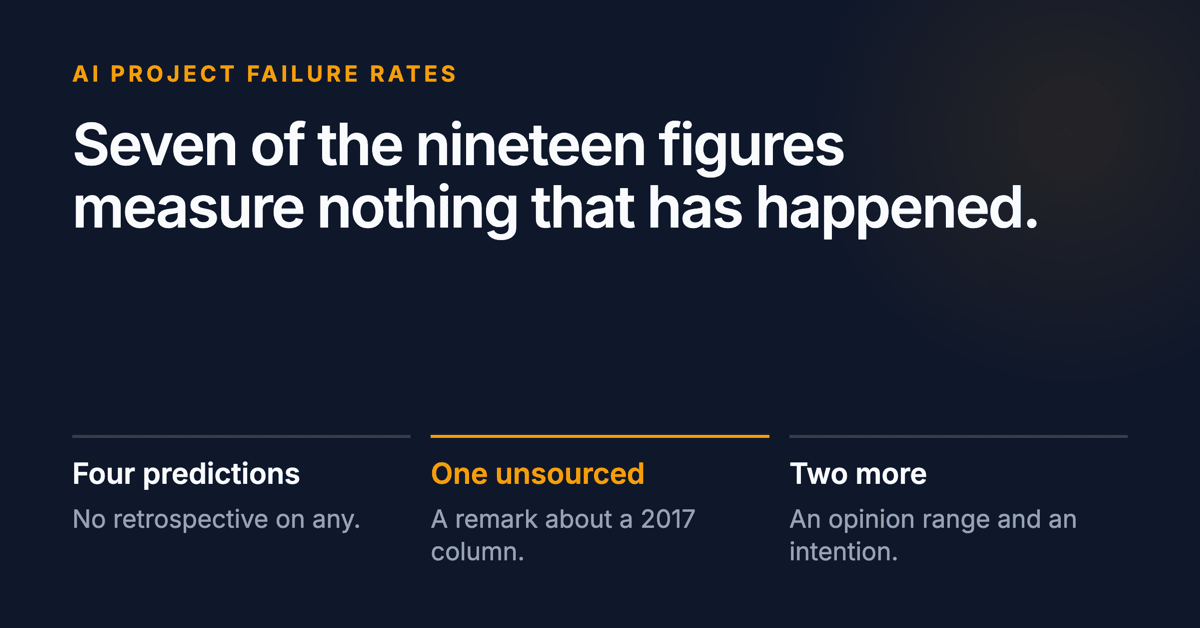
I spent several weeks tracing nineteen of the most-cited figures back to their primary sources for a review paper. The apparent agreement between them is an artefact. They range from 5% to 95% because they are counting different things, over different units, across different windows, and seven of the nineteen are not measurements of anything that has actually happened.
You don't need to do that work. You need four questions, and they take about ninety seconds.
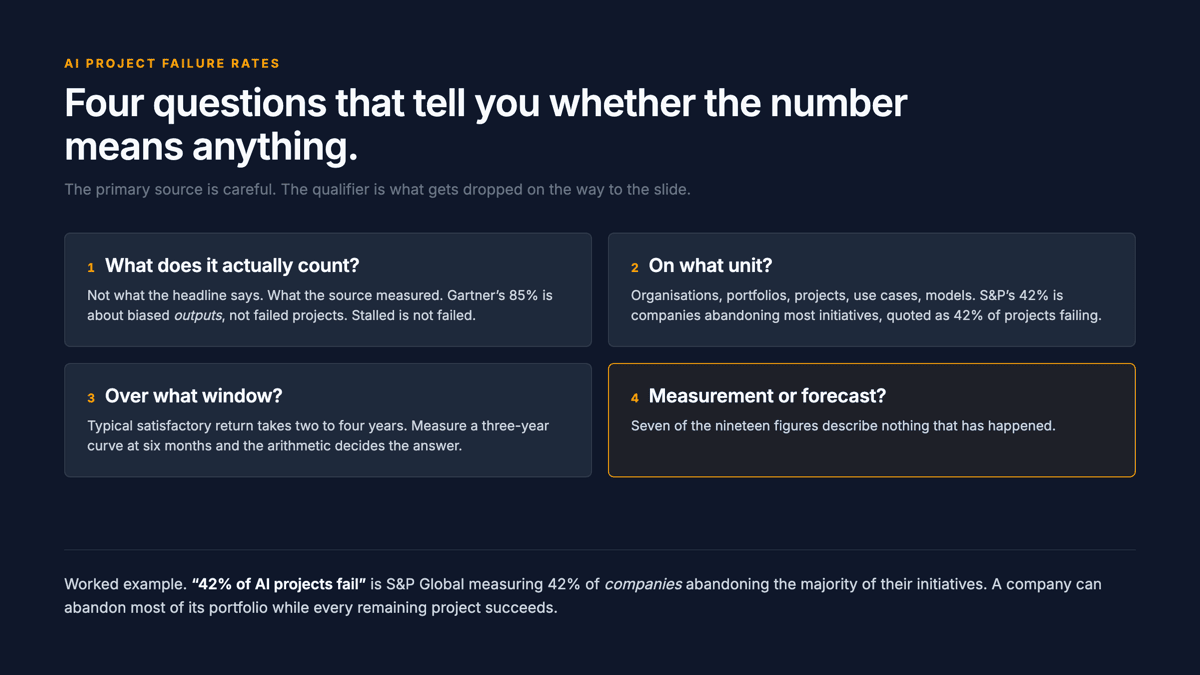
One: what does it actually count?
Not what the headline says. What the source measured.
Gartner's 85% is the one everyone knows, and it doesn't say what people think. It says 85% of AI projects will deliver erroneous outcomes due to bias in data, algorithms or the teams managing them. That's a claim about output quality. It is not a claim about projects failing, and a project can deliver a biased outcome and still be running happily today.
Alegion's 78% is about projects stalling at some stage before deployment. Stalled is not failed. Things that stall get restarted.
BCG's 74% is companies that "have yet to show tangible value". That's a statement about timing, not outcome. Every company that eventually succeeds passes through a period of having yet to show value.
The pattern is consistent: the primary source is careful, and the qualifier is what gets dropped on the way to the slide.
Two: on what unit?
This is the one that does the most damage, because the substitution is invisible.
S&P Global's 42% is the share of companies that abandoned the majority of their AI initiatives. It gets quoted as "42% of AI projects fail". Those are different claims about different things, and neither implies the other. A company can abandon most of its portfolio while its remaining projects all succeed.
Watch the unit move across the field: organisations, portfolios, projects, use cases, models. Gartner's April 2026 figures are about use cases: 28% fully succeeding, 20% failing outright. Roughly half sit in a middle band of partial success, which vanishes the moment someone cites it as "72% fail".
Deloitte demonstrated the mechanism accidentally. Two-thirds of respondents expected 30% or fewer of their experiments to scale. Nearly three-quarters of the same pool said their most advanced initiative was meeting or exceeding expectations. Same people, same week. Ask about the portfolio and you get a failure headline. Ask about the best project and you get a success story.
Three: over what window?
Deloitte's survey of 1,854 organisations found typical satisfactory return on a use case arrives in two to four years, with only 6% seeing payback inside one year.
Now consider the MIT NANDA report, the source of the 95% that went round the world last year. Its criterion is roughly six months post-pilot. Measure a three-year payback curve at six months and you will classify most on-track projects as failures. That is not a finding. It is arithmetic.
The report's own limitations section concedes the point, saying the window may be insufficient and may be understating success rates.
That sentence is in the report. I could not find it in any of the coverage.
Four: is it a measurement or a forecast?
This is the question that surprised me most, and it is the one that changes how you read the field.
Of the nineteen figures I classified, seven are not measurements of anything that has happened.
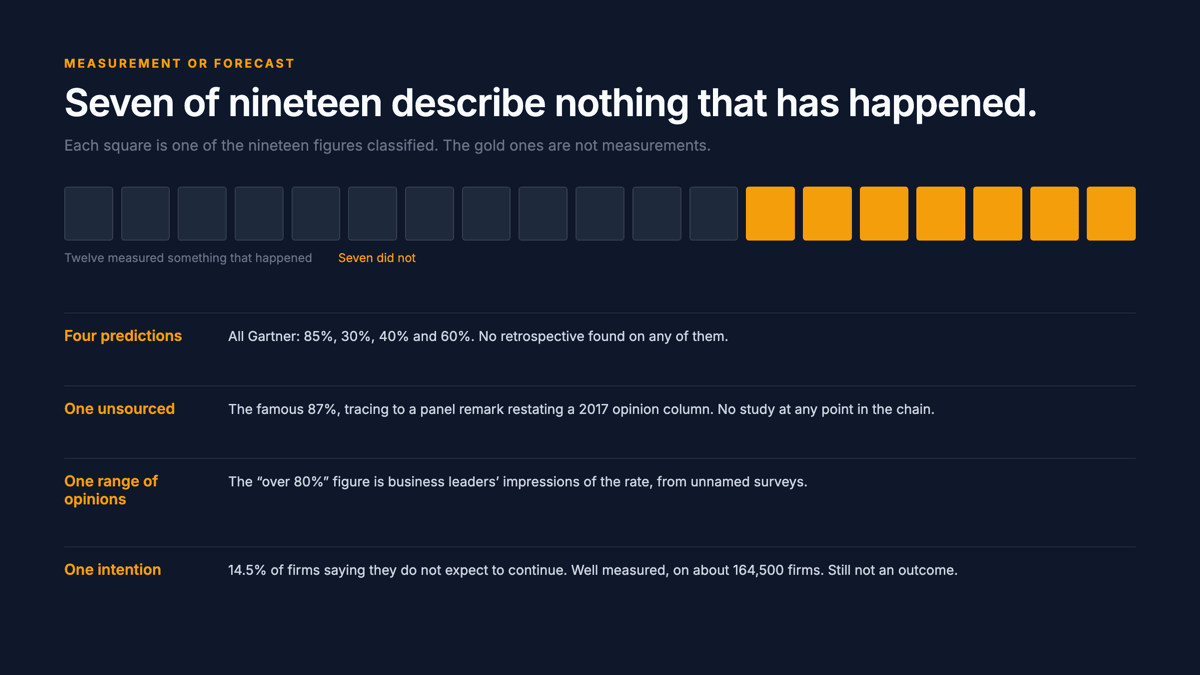
Four are Gartner predictions: 85% through 2022, 30% by end of 2025, 40% by end of 2027, 60% through 2026. Predictions are legitimate. They are also unfalsified until their date arrives, and I could find no Gartner retrospective on any of the four. They remain unaudited.
One, the famous 87%, is unsourced in a specific and instructive way. It traces to a conference panel remark, restating an unsourced 13% from a 2017 opinion column. There is no study at any point in the chain. The referent also changes along the way.
One is a range of opinions. RAND's ">80%" quotes a Fortune article reporting business leaders' impressions of the failure rate, given as 83 to 92%, from unnamed surveys. It is a measurement of what people believe the number is.
And one measures an intention rather than an outcome: 14.5% of US firms using AI say they do not expect to continue. Robustly measured, on about 164,500 firms. It tells you what they expect, not what they did.
None of these is dishonest. Every one of them becomes dishonest the moment it is repeated as "the AI failure rate".
What to do with this
Next time a number lands in your feed, ask the four in order. What does it count. On what unit. Over what window. Measurement or forecast.
If you can't answer all four from the post you're reading, you have learned something useful: whoever wrote it couldn't either.
And if the answer is that it's a forecast about use cases with no stated window, quoted as a measured failure rate for projects, you now know exactly how much weight it will carry in your own decision. Which is the point. This isn't about being clever at other people's expense. It's about knowing whether the thing you're about to act on is describing the world or describing somebody's expectations of it.
The four questions cost ninety seconds. The board paper that cites the wrong one costs considerably more.